Sunday, June 16, 2013

Arctic Sea Ice September 2013 Projections

What will the Arctic Sea Ice look like in September 2013?

Several projections for Arctic sea ice extent are being discussed at places such as ARCUS (Arctic Research Consortium of the United States) and the Arctic Sea Ice Blog. The image below, from ARCUS, shows various projections of September 2013 arctic sea extent (defined as the monthly average for September) with a median value of 4.1 million square kilometers, with quartiles of 3.8 and 4.4 million square kilometers.


Note that sea ice extent in the above projections is defined as area of ocean with at least 15% ice, in line with the way the NSIDC calculates extent. By contrast, the Danish Meteorological Institute includes areas with ice concentration higher than 30% to calculate ice extent.

Rather than looking at the projected average for September, one could also project the minimum value for September 2013. And rather than looking at sea ice extent, one could also look at sea ice area, which differs from sea ice extent as the NSIDC FAQ page describes:
A simplified way to think of extent versus area is to imagine a slice of Swiss cheese. Extent would be a measure of the edges of the slice of cheese and all of the space inside it. Area would be the measure of where there is cheese only, not including the holes. That is why if you compare extent and area in the same time period, extent is always bigger.
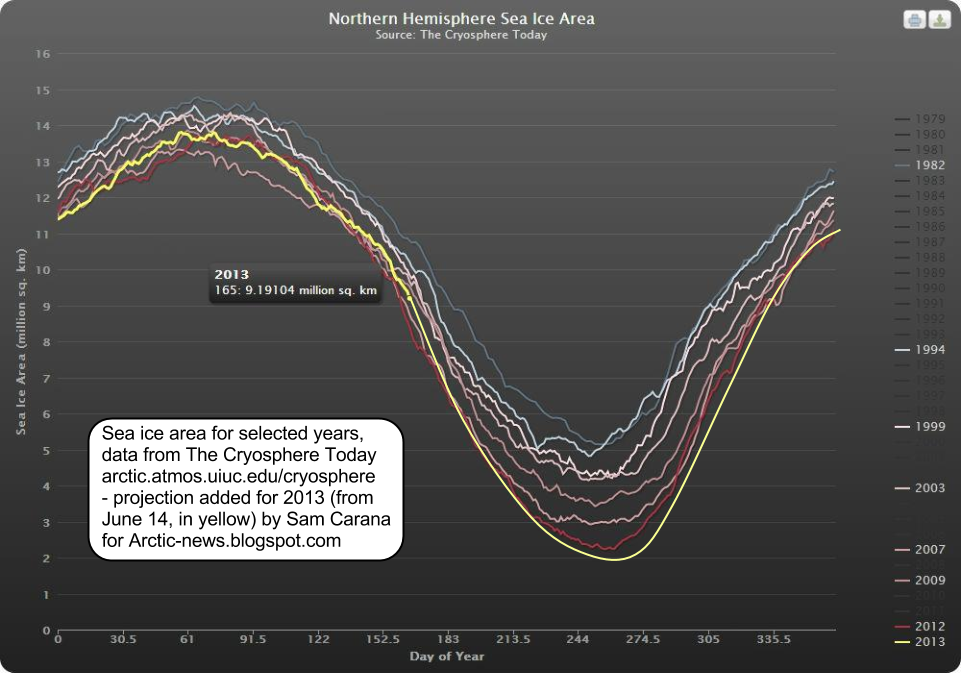

Above image shows Sam Carana's projected minimum area of 2 million square km for 2013, based on data by Cryosphere Today and on numerous factors, such as continued warming of the water underneath the ice, stronger cyclones, etc.
Roughly in line with above image, by Wipneus, Sam Carana's projection for Arctic sea ice minimum volume is 2,000 cubic km in September 2013.

Readers are invited to submit comments below with further projections.

Thursday, June 13, 2013

Datuk Raja Mohamed Affandi is Malaysian Army Chief from today

https://blogger.googleusercontent.com/img/b/R29vZ2xl/AVvXsEiRGeU9vHy2ra4G8edzlez7iBjLt3RYheGJoxZLGfjZVWAiCc9SudgHNiCvZF57w_BYioWg4bthV7DRSZFbjHXEtqNjp0opw87J1VO2aXOp2E4wKWcHHVuF7TQSioNIAK6OqNnnfdjVQ7I/s1600/ketua-staf-markas-atm.png 

  KUALA LUMPUR: Former Malaysian Armed Forces Chief of Staff Datuk Raja Mohamed Affandi Raja Mohamed Noor, 56, has been appointed Malaysian Army Chief effective Friday.
    Defence Minister Datuk Seri Hishammuddin Tun Hussien Raja Mohamed Affandi, 56, made the announcement during a ceremony held at the Wisma Pertahanan here in Kuala Lumpur.
    Raja Mohamed Affandi was promoted to full General during the ceremony.  He replaces Tan Sri Zulkifli Zainal Abidin, 52, who has been appointed as vice-chancellor of Universiti Pertahanan Nasional Malaysia (UPNM) effective Saturday. 

Arctic sea ice thickness falls by 2m in 21 days in some areas

For years, warnings have been raised about the dramatic decline of Arctic sea ice. Various posts at this blog have also analyzed the exponential nature of the decline in summer sea ice volume and the many feedbacks that fuel this decline. And for years, the conclusion has been that - without action - the sea ice looks set to disappear altogether within years.

Yet, many are still ignoring this warning, often with remarks such as "some of the ice is 5 meters thick; it would take decades for all that ice to melt!" Thick ice does indeed pile up along the northern coast of Greenland and Ellesmere Island, due to the way the ice drifts. This has lead some to argue that an S-shaped curve (sigmoid or gompertz trendline) was more appropriate, with the decline in sea ice volume slowing down as it approaches zero.

However, this argument doesn't seem make much sense, since such a S-shaped trendline would only apply to a relatively small area with very thick sea ice. Exponential curves would still remain the best fit to predict the decline of the sea ice in the Arctic Ocean at large.

Moreover, is it really more appropriate to say that summer sea ice looks set to virtually disappear within years, with just a tiny sliver of ice remaining north of Greenland and Ellesmere Island, instead of saying that the sea ice looks set to disappear altogether within years? How persistent will such a sliver really be?

One of the feedbacks of sea ice decline is that, as the decline progresses, cyclones can be expected to hit the remaining sea ice ever harder. How much damage can such cyclones and further feedbacks do? A previous post describes thin spots developing in the sea ice under the influence of a cyclone. The image below shows areas at the center of the Arctic Ocean (large circle) where thickness of the sea ice fell from 2 meters to 1 meters over a period of 21 days. Furthermore, the image below also shows that, over this period, 5m-thick ice was reduced to 3-meters thickness (top small circle), while 2m-thick ice was reduced to zero (bottom small circle).

2m falls in thickness in 21 days - click on image to enlarge
In conclusion, without action the Arctic sea ice looks set to continue to decline exponentially, while strong feedbacks such as cyclones developing when there is more open water, look set to add to the decline and cause the Arctic sea ice to disappear completely within years. For an overview of lines of action, see this post at the methane hydrates blog.

Sunday, June 9, 2013

SOCOM Wants Iron-Man Suits for the A Teams


The US Special Operations Command is looking for revolutionary new gear assisting troops in exceeding human performance in combat. The idea sounds similar to a science fiction tale, but if the command will be successful in its quest – this time it may be real. The command has posted a request for information (RFI) to government research centers, academy and industry, to provide information that could contribute to the evolution of the Tactical Assault Light Operator Suit, or TALOS.

 The kit will be applied as part of a futuristic uniform suit, using powered exoskeleton providing the wearer superhuman strength or ultra protection with full-body ballistic armor. Using wide-area networking, wearable computers and antennae, operators will have more situational awareness, through bionic visual and aural sensing. Other technologies that could be implemented include non-visual means of information display, including the utilization of cognitive thoughts and immersive displays depicting personalized information over the surrounding environment. health and medical monitoring features could employ embedded monitoring, oxygen supply systems, wound stasis and electromechanical compensation. Thermal and Energy generation and management are also likely to be explored.


SOCOM issued the RFI on the US Government Federal Opportunity Bulletin board, and is expecting submissions by June 15. The command expects submissions of technologies already in development (TRL 5 or higher) that could be demonstrated in a short term. As much as this vision seems futuristic, SOCOM is looking for practical, near-term capabilities. typical of the command’s no nonsense attitude, the technologies selected for demonstrations should be integrated to form an initial capability within twelve months. A secondary goal is to determine the feasibility of fielding objective capabilities within three years. Such technologies could be submitted by research and development organizations, private industry, government labs and academia as well as individuals.
One of the responders is the U.S. Army Research, Development and Engineering Command (RDECOM), is one of the government establishments that have responded to the call. “There is no one industry that can build it,” said SOCOM Senior Enlisted Advisor Command Sgt. Maj. Chris Faris during a panel discussion at a conference at MacDill Air Force Base, Fla. The demonstrations of relevant technologies would take place a month later, on July 8-10, in Florida.

TALOS will have a physiological subsystem that lies against the skin that is embedded with sensors to monitor core body temperature, skin temperature, heart rate, body position and hydration levels. The body armor could consist of magnetorheological fluids – also known as ‘liquid body armor’ – that transforms from liquid to solid in milliseconds when a magnetic field or electrical current is applied. Though still in development, this technology will likely be submitted to support TALOS.
“[The] requirement is a comprehensive family of systems in a combat armor suit where we bring together an exoskeleton with innovative armor, displays for power monitoring, health monitoring, and integrating a weapon into that – a whole bunch of stuff that RDECOM is playing heavily in,” said. Lt. Col. Karl Borjes, an RDECOM science advisor assigned to SOCOM. “RDECOM cuts across every aspect making up this combat armor suit,” Borjes said “It’s advanced armor. It’s communications, antennas. It’s cognitive performance. It’s sensors, miniature-type circuits. That’s all going to fit in here, too.”

One of the programs that could be considered for this quest is ‘Warrior Web’, an exoskeleton capability currently managed by the Defense Advanced Research Agency (DARPA) and the U.S. Army, exploring a new kit enabling soldiers to reduce fatigue and potential injuries caused by excessive loads they carry on dismounted operations. DARPA’s Warrior Web is a soft, lightweight under-suit that will augment the work of the Soldiers’ own muscles, to significantly boosting endurance, carrying capacity and overall warfighter effectiveness–all while using no more than 100 Watts of electrical power.

The Warrior Web program consists of two related program tasks – the first task currently underway aims to develop a mix of core ‘critical technologies’, deemed criticalCurrently underway, Task A seeks to develop a mix of core technologies deemed critical for the program’s success. On the second phase, scheduled to commence in fall 2013 researchers will develop and fabricate an integrated suit that would eventually undergo real-world testing to evaluate its performance.
A prototype suit is already undergoing testing at the U.S. Army Research Laboratory Human Research and Engineering Directorate (ARL HRED), evaluating various prototype devices. The testing evaluates how each prototype incorporates different technologies and approaches to reduce forces on the body, decrease fatigue, stabilize joints and help Soldiers to maintain a natural gait under a heavy load. The testing uses a multi-camera motion-capture system to determine any changes in gait or balance, a cardio-pulmonary exercise testing device to measure oxygen consumption and a variety of sensors to collect force, acceleration and muscle activity data.

Saturday, June 8, 2013

Chinese PLAAF J-20 at dusk

Make sure you note the radar characteristics of this copycat stealth technology....there must be something which gives the location of the aircraft away......

Maybe be the aircraft location is known when the pilot switches on the radio/radar?  Or that technology too has been copied from the F-22 ?


Thursday, June 6, 2013

Thin Spots developing in Arctic Sea Ice

From the start of 2013, Arctic sea ice extent has roughly followed the same path it did in 2012 when a historic record low was reached, as discussed in a previous post. At the moment, thinner spots are developing in the sea ice, as illustrated by the image below.


These thin spots are developing due to a combination of factors:
  • a cyclone over the Arctic
  • low North Hemisphere snow cover causing more sunlight to be absorbed, rather than reflected back into space
  • warm sea surface temperatures at edges of sea ice, as illustrated by the image below
  • ice thickness is very low, as illustrated by the image further below
NOAA image, click to enlarge
Arctic sea ice volume/extent ratio by Neven (click to enlarge image)
Below, a 30-day Naval Research Laboratory animation illustrating the development of the thinner spots. 

For the most updated version of this animation, click here. 
For years, observation-based projections have been warning that Arctic sea ice will disappear within years, with dire consequences not only for the Arctic, but for the world at large. Hopefully, more people will realize the urgency of the situation and realize the need for a comprehensive and effective plan of action as described here. 

Image adapted from TheCryosphereToday by Albert Kallio, contributor to the Arctic-news blog
Albert Kallio comments:
"NORTH POLE STORM IN MAY / JUNE 2013 AND SEA ICE SHATTERING AND COMPACTION 06/06/2013

Due to a constant thinning of the Arctic Ocean ice cover it has become sensitive to shearing by ocean wave penetration, winds and ocean currents. As a result of this weakening, a relatively small but persistent storm that centred over the North Pole managed to shatter 75%, or three quarters of Arctic Ocean's ice cover into free ice floes.

Because of the earth's spin, winds and ocean currents, the North Pole immediacy saw vast leads opening in colossal numbers, lots of broaken ice has migrated towards the Atlantic Ocean via the Fram Strait, the Barents and Kara Seas.

The situation is opposite on the Pacific Ocean end of the Arctic Ocean where ice cannot escape further south due to Eurasian and North American land barrier blocking further southward ice movements. These areas have seen densification of sea ice as the broken ice has packed against the Arctic Ocean’s perimeter coastlines.

The Arctic Ice Cover break up is a dangerous situation because the insolation (sunlight amount) and heat carryover from the continent (currently snow free) is the greatest on perimeter in far south (the Bering Strait).

The 06/06/2013 situation is suggestive that:

(1.) The high Arctic Basin will face aggressive melting as sunlight pours into the open leads of dark water, leading to opening of this part of the ocean early.

(2.) The compaction zone in Alaska will later follow the suit as the ice gets pushed against the warm coastal seas.

(3.) Despite good (near 100%) ice cover, on the compaction zone, the ice will melt also here as the heat carry over from the continent (south) is here the greatest.

(4.) The sunlight amount and the length of the annual melt season are the greatest in the far perimeters of the Arctic Ocean (around the Bering Strait).

(5.) The brokenness of sea ice cover into countless ice floes increases its three dimensional surface area in water which helps the transmission of heat from the sea water into ice. Sea water retains large thermal inertia (capacity to store heat. This melts ice when the warm sea water gets in contact with sea ice’s frozen surfaces).

(6.) Where leads occur within ice, a strong vertical mixing of sea water also increases melting.

(7.) The brokenness of North Pole’s ice cover and its reduced ice amount reduces the sea ice congestion (gridlock) making it much easier to escape to the Atlantic Ocean via the Fram Strait, the Barents and Kara Seas." 
Image adapted from University of Bremen by Albert Kallio, contributor to the Arctic-news blog
Albert Kallio, commenting on above image:
BREAK UP OF NORTH POLE SEA ICE CAP AS AT 9TH JUNE 2013

The Arctic Ocean ice cover has broken up unexpectedly early and the sea ice is particularly shattered in the viscinity of the North Pole posing huge uncertainties how the sea ice (and the polar bears, walruses and seals on it) can survive until autumn. The dark violet represents good, solid sea ice cover. The more coloured, the more shattered and reduced the sea ice cover is.

Paul Beckwith adds (extracted from Paul's June 10, 2013, blogpost  Why Arctic sea ice will vanish in 2013):
Within the last few weeks, cyclonic activity has returned and once again caused substantial thinning and weakening of the sea ice near the North Pole. Ice near the center of cyclonic activity, recently 2 to 2.5 metres thick, has thinned to roughly 1.25 metres. This in less than 2 weeks: unprecedented so early in the melt season. More significantly, in the last few days a gaping “hole” has appeared in the much thicker ice just north of the Canadian Arctic Archipelago. Ice that was recently 3.5 to 4 metres thick is now less than 2 metres thick in the hole.

The hole is likely due to a combination of divergence of the ice away from the rotating cyclone center, and the upwelling (churning up) of warm, salty sea water below. The most rapid melting and ice deterioration is occurring below the surface (where the cold surface air temperature can’t slow melting).

The magnitude of the most recent cyclonic activity is not unusual, although the persistence is. What is also new in the equation is the ability of these common cyclones to degrade the ice, and do so very early in the melt season. Also new is the substantial increase in amplitude, frequency and duration of cyclonic activity in the Arctic Ocean basin. The thinning ice cover not only breaks up easier now (even by relatively small and weak cyclones), more open water leads to an increase in melting and storm intensity.

It’s for all these reasons I find it extremely difficult to comprehend how any sea ice will be left after this year’s summer ‘melt season’.
Below, Paul Beckwith's animation Arctic sea ice thickness + motion June 10 2013, based on Naval Research Laboratory data.

Tuesday, June 4, 2013

The Tornado Connection to Climate Change


By  Paul Beckwith, B.Eng, M.Sc. (Physics),
Ph.D. student (Climatology) and Part-time Professor,
University of Ottawa

"In 2012, 93 percent of natural catastrophes were weather-related disasters. The United States was seriously affected: it accounted for 69% of overall losses and 92% of insured losses due to natural catastrophes worldwide." ~ World Watch Institute

"America has some of the wildest weather on the planet, and it turns out those extremes – which run from heat waves and tornadoes to floods, hurricanes and droughts – carry a heavy price tag." ~ theguardian

3D look at the Moore Oklahoma thunderstorm and tornado, up to 50,000 ft. Image by Tony Petrarca
from Tony's Pinpoint Weather Blog showing the funnel touching the ground just outside of Moore. 
The mega-storm that generated the massive cyclonic system that passed over the central U.S (from May 18th through May 20th) spawned many storm systems and severe tornadoes. In Oklahoma, it took less than 1 hour for a thunderstorm system to develop into a full-blown 3 km diameter tornado of the highest size/strength (EF5). As you know, this tornado caused total devastation along a swath greater than 30 km long and about 3 km wide in the southern part of the city. Two schools and a hospital were destroyed resulting in heavy loss of life.

The actual tornado tracked through the most built up part of the city and had a length of 6.22 km (Image 2). As bad as this was, if the tornado had tracked further north by about 10 km, the path length through the built-up part of the city would have been about 28 km and likely would have resulted in FOUR TIMES MORE DAMAGE.

The high altitude jet stream guided this storm directly over Oklahoma City and was a key ingredient responsible for the extremely rapid development of the tornado witnessed. Unfortunately, the location, strength, waviness, and behavior of the jet stream is changing as a result of rapid climate change. You can get use to more “Climate Bomb” extreme weather events – there is nothing to be surprised about here.

Greenhouse gas emissions from humans have warmed the planet since about 1850; the warming rate has stepped up a notch over the past several decades, and even more so now with ‘feedbacks’ kicking in big time.

There is less snow cover on the land over northern Canada, northern Eurasia and Siberia, and there is less sea ice over the Arctic Ocean. The snow and ice reflects greater than 80% of the incoming light from the sun back into space keeping these areas colder. With less snow the dark land is uncovered and with less sea ice the dark ocean is uncovered. These both reflect much less light; only about 20% and 10% respectively. The rest is absorbed and heats the ground and sea. The melting ground is releasing methane; the warming sea heats the sea floor and that warming releases more methane. Thus, parts of the high Arctic are warming at 5 to 6 times the average global rate. The equator temperature does not change as much (even seasonally the change is only about 3°C over the year). Thus, the temperature gradient between the equator and Arctic is greatly reduced.

By basic physics and meteorology, this reduced equator-pole temperature difference slows the west to east wind component. Fast jet streams circle the earth from west to east; as they slow they become much wavier and travel much more northward and southward. Regions north of the wavy jets are cold and dry (air source is cold Arctic) while regions south of the wavy jets are hot and moist (air source is equatorial marine regions). The jet is thus an intersection of these two different types of air masses (with cold fronts and warm fronts, respectively). The large local temperature gradients give rise to large pressure gradients resulting in extreme (and very unstable) weather regions.

May 20, 2013 Moore, Oklahoma tornado
Since the wave troughs carry cold air very far south and the wave crests carry warm moist air far north, the frontal temperature gradients are larger under climate change then they were before and thus the storm magnitudes are now larger. That’s why I wrote earlier that we shouldn’t be surprised.

Global warming also brings greater ocean evaporation and warmer air can carry more water vapor – in fact, in the last 3 decades or so there has been a 4% increase in atmospheric humidity. When this water vapor condenses to forms clouds, energy is released. Greater energy in the atmosphere thus fuels more violent storms, and Climate Bombs are born.

The Oklahoma tornado is just another example of the global ‘weirding‘ that we are seeing. Our reference frame is the “old climate”, in which the equator-polar temperature gradients are smaller, but the local frontal temperature gradients are larger. In our “new climate” (in which there is much less sea ice in the Arctic) this type of tornado will be much more probable — at least while we abruptly transition from the “old” to the “new” and unfamiliar climate.

Our future is a world with much warmer global temperatures. Paleoclimate records show temperature rises of 6 to 10°C within two decades have occurred many times in the past over Greenland; in one case the rise was 16°C. I see no reason why this will not occur again.

Put your seat belt on . . . oil profits can’t save you from Climate 2.0.


Related posts

- Killer El Reno Tornado Was Widest Ever Recorded: NWS

- Climate change causing US wildfire season to last longer, Congress told