Showing posts with label Peter Wadhams. Show all posts

Saturday, February 28, 2015

The Mechanism

What is the mechanism behind accelerated warming of the Arctic Ocean, huge abrupt methane eruptions from the seafloor of the Arctic Ocean and skyrocketing temperatures?


1. Potential for Methane Release in Arctic

Vast amounts of methane are stored in hydrates under the seafloor of the Arctic Ocean. Furthermore, vast amounts of methane in the form of free gas are contained in sediments under the seafloor of the Arctic Ocean. Thirdly, vast amounts of carbon are frozen in the permafrost and much may enter the atmosphere in the form of methane as the permafrost continues to thaw.

Natalia Shakhova et al. in 2010 estimated the accumulated potential for the East Siberian Arctic Shelf (ESAS) region alone (image on the right) as follows:
- organic carbon in permafrost of about 500 Gt
- about 1000 Gt in hydrate deposits
- about 700 Gt in free gas beneath the gas hydrate stability zone.

In early 2014, Sam Carana estimated annual methane emissions from hydrates and permafrost at 100 Tg (i.e. 0.1 Gt). This methane will contribute to further warming of the air over the Arctic and the North Atlantic, causing further extreme weather events, such as heatwaves and storms along the path of the Gulf Stream from the North Atlantic into the Arctic Ocean, in turn triggering further releases from hydrates at the seafloor of the Arctic Ocean and threatening to escalate into runaway global warming.


Such methane eruptions are caused by warming water of the Arctic Ocean, which in turn is due to emissions by people. Some elements of the mechanism causing methane to erupt from the seafloor are described in more detail below.

2. Ocean Heat
From: Ocean Temperature Rise continues
Above graph, based on NOAA data, shows a polynomial trendline pointing at an October Northern Hemisphere sea surface temperature anomaly rise of more than 5°C (9°F) by 2050, compared to the 20th century average, from an earlier post.

Waters at greater depth are also warming rapidly, as illustrated by the image on the right, from an earlier post, showing a rise in ocean heat up to 2000 m deep that has more than doubled over the past decade. Data from 2005 through to 2014 contain a polynomial trendline that points at a similar rise by 2017, followed by an even steeper rise.

The North Atlantic is warming rapidly, with sea surface temperature anomalies as high as a 12°C (21.6°F) recorded east of North America earlier this year, as illustrated by the image below.

A warmer North Atlantic is a major contributor to the rapidly warming waters of the Arctic Ocean, since the Gulf Stream keeps carrying warmer water into the Arctic Ocean all year long.

A further contributor is a warmer North Pacific.

Further contributions come from the combined impact of numerous feedbacks, in particular changing winds and currents, cryosphere changes and methane releases, as further described below.

From: Watch where the wind blows

3. Feedbacks: Changing Winds and Currents, Cryosphere Changes and Methane

- Changed Winds and Currents

Emissions by people are not only causing temperatures of the atmosphere and oceans to rise, they are also causing winds and ocean currents to change. Such changes can in turn result in heatwaves that are more intense and that persist for prolonged periods. Furthermore, strong northbound winds, combined with strong precipitation and waves can speed up the volume of warm water carried by Gulf Stream into the Arctic Ocean, as discussed in an earlier post

- Arctic Sea Ice

A warming atmosphere, warming oceans and decline of the Arctic snow and ice cover all go hand in hand. The IPCC concluded in AR5 that, for RCP8.5, the Arctic Ocean will likely be nearly ice-free in September before mid-century. Prof. Peter Wadhams warned, back in 2012, that the Arctic Ocean could be virtually ice-free within a few years. An exponential trendline based on sea ice volume observations shows that sea ice looks set to disappear in 2019, while disappearance in 2015 is within the margins of a 5% confidence interval, reflecting natural variability, as discussed at the FAQ page.


- Permafrost

Permafrost decline will cause Arctic temperatures to rise, due to albedo change and due to carbon that is contained in the permafrost and that can be expected to be released in the form of methane or carbon dioxide as the permafrost thaws. The image below pictures permafrost decline as foreseen by the IPCC in AR5. 


Obviously, rapid decline of the sea ice will come with albedo changes that will also make the permafrost decline more strongly than the IPCC foresees, while they will also cause even more extreme weather events. One of the dangers is that huge amounts of warmer water will flow from rivers into the Arctic Ocean, as discussed below.

- Warmer Water From Rivers

More sunlight getting absorbed in the Arctic will accelerate warming of the Arctic Ocean directly, while there will also be warmer water flowing into the Arctic Ocean from rivers in Siberia and North America, fueled by stronger and longer heatwaves, storms and wildfires. 

map from: http://en.wikipedia.org/wiki/File:Rs-map.png
Above map shows that a number of large rivers in Siberia end up in the Arctic Ocean. Another large river is the Mackenzie River, which ends in the Beaufort Sea, north of Alaska, where sea surface temperatures of about 20°C (68°F) were recorded in 2013, as the image below illustrates.


Another area of concern, also marked with a purple oval in the image below, is located in the north of Canada.


More extreme weather events include heat waves, storms, floods and wildfires, all of which can contribute to more rapid warming of the Arctic Ocean.

The combined effect of all the above will be that methane that is now contained in the form of free gas and hydrates in sediments under the Arctic Ocean, can be expected to be increasingly released as the Arctic Ocean warms further.

- Methane 

Of the vast amounts of methane stored in the Arctic, much of it is prone to be released with further temperature rises, as discussed in this earlier post and in this earlier post. Cracks in sediments used to be filled with ice. Warmer water is now melting the ice that used to sit in cracks. This ice has until now acted as a glue, holding the sediment together. Moreover, the ice in the cracks has until now acted as a barrier, a seal, that prevented the methane contained in those sediments from escaping. In a video interview with Nick Breeze, Natalia Shakhova mentions a sample of sediment taken from the ESAS seafloor in 2011 that turned out to be ice-free to a depth of 53 m at water temperatures varying from -0.6˚C to -1.3˚C. Back in 2008, Natalia Shakhova et al. considered release of up to 50 Gt of predicted amount of hydrate storage as highly possible for abrupt release at any time.

The image below, based on data from the IPCC and the World Metereological Organization (WMO), with an added observation from a NOAA MetOp satellite image, illustrates the recent rise of methane levels and the threat that methane levels will continue to rise rapidly.


When looked at from a longer range of years, above image fits in the black square on the image below.


The image below shows exponential rise based on data of East Siberian Arctic Shelf (ESAS) releases alone, as discussed in an earlier post.


Non-linear rise is supported by the fact that methane's lifetime increases as more methane enters the atmosphere. As the image below shows, peak methane levels have been very high recently.


All these feedbacks can interact and amplify each other in non-linear ways, resulting in rapid and intense temperature rises, as illustrated by the image below.

Diagram of Doom - for more background, see Feedbacks

4. Runaway Global Warming

The threat is that such rapid temperature rises will appear at first in hotspots over the Arctic and eventually around the globe, while also resulting in huge temperature swings that could result in depletion of supply of food and fresh water, as further illustrated by the above image, from an earlier post, and the image below, from another earlier post.

Rapidly rising temperatures will cause stronger evaporation of sea water. Since water vapor is one of the strongest greenhouse gases, this can further contribute to the non-linear temperature rises pictured above.

In conclusion, the situation is dire and calls for comprehensive and effective action, as discussed at the Climate Plan blog.


Monday, January 19, 2015

Temperature Rise

Record High Temperatures in 2014

The year 2014 was the warmest year across global land and ocean surfaces since records began in 1880, writes NOAA, adding the graph below. This graph illustrates that temperatures have risen even when focusing on a relatively short recent period with a linear trendline starting in 1998, which was an El NiƱo year, whereas 2014 wasn't.

Source: NOAA Global Analysis - Annual 2014
Most Appropriate Trendline

While the purple 1998-2014 trendline serves the useful purpose of dispelling the myth that warming had halted recently, it isn't the most appropriate trendline, since extending this trendline backward to 1880 would leave too many data too remote from the trendline, as is further illustrated by the animated image below.


What about the blue linear trendline that is based on data for all the years from 1880 to 2014? By that same logic, the appropriateness of this trendline must also be questioned. Temperatures in recent years have been well above this trendline. A polynomial trendline seems a much better fit, as illustrated by the image below.


Above image also extends the trendline forward, showing that 2 degrees Celsius warming looks set to be exceeded in 2038, based on the same data.

And while this is a frightening scenario, the picture may well be much too optimistic, because the heat is felt most in the Arctic Ocean, the very location where some of the most terrifying feedbacks are accelerating local warming, as further explained below.

Feedbacks in the Arctic

As NOAA writes, much of the record warmth for the globe can be attributed to record warmth in the global oceans, which reached the highest temperature among all years in the 1880–2014 record.


As above image shows, ocean heat reached a record high in 2014. In other words, it was ocean heat that pushed the combined ocean and land temperature to a record high. Anomalies were especially high in the Arctic Ocean, as illustrated by the image below.


Waters close to Svalbard reached temperatures as high as 63.5°F (17.5°C) on September 1, 2014 (green circle). Note that the image below shows sea surface temperatures only. At greater depths (say about 300 m), the Gulf Stream is pushing even warmer water through the Greenland Sea than temperatures at the sea surface.


Since the passage west of Svalbard is rather shallow, a lot of this very warm water comes to the surface at that spot, resulting in an anomaly of 11.9°C. The high sea surface temperatures west of Svalbard thus show that the Gulf Stream can carry very warm water (warmer than 17°C) at greater depths and is pushing this underneath the sea ice north of Svalbard.


Planetary energy imbalance (0.6 W/m2) equals the amount of energy in exploding 400,000 Hiroshima atomic bombs per day, 365 days/year (J. Hansen, 16 Jan. 2015).


Planetary imbalance now is 0.6 W/m2. This has made the rise in ocean heat (up to 2000 m deep) more than double over the past decade. Data from 2005 through to 2014 contain a polynomial trendline that points at a similar rise by 2017, followed by an even steeper rise.

What could cause such non-linear rise?

The answer is feedbacks. Arctic snow and ice loss alone may well cause over 2 W/m2 warming, warns Prof. Peter Wadhams. Another such feedback is methane erupting from the ocean floor, as methane hydrates get destabilized due to higher temperatures.

As illustrated by the graph below, most of this excess heat is absorbed by oceans and ice. Some of the heat is consumed by the process of melting ice into water, and 93.4% of this excess heat ends up warming up the oceans.

Graph by Sceptical Science based on study by by Nuccitelli et al.
As the Gulf Stream keeps carrying ever warmer water into the Arctic Ocean, methane gets released in large quantities, as illustrated in the images below showing high methane levels over the East Siberian Arctic Shelf (red oval left) and over Baffin Bay (red oval right) with concentrations as high as 2619 ppb.

click on image to enlarge
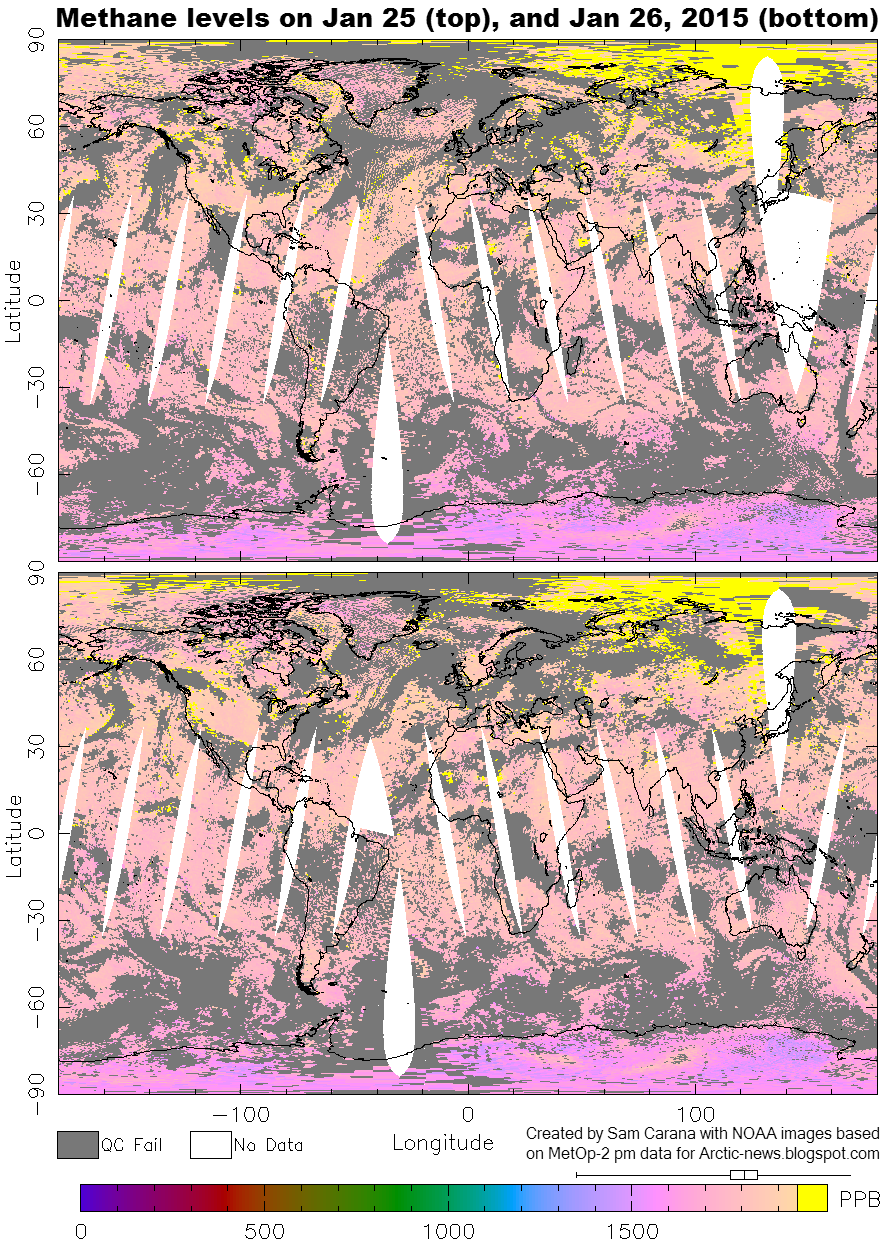
The images below show methane levels on Jan 25 (top), and Jan 26, 2015 (bottom).


The threat is that huge amounts of methane will erupt from the seafloor of the Arctic Ocean over the coming decades, as illustrated by the image below.

For more on this image, see this post and this page.
Demise of the Arctic sea ice and snow cover is another terrifying feedback. The image below features a NASA/Goddard Space Flight Center Scientific Visualization Studio screenshot showing decline of multi-year Arctic sea ice area over the years.


Below is a video by Nick Breeze who interviews Professor Peter Wadhams on multi-year Arctic sea ice.


An exponential trendline based on sea ice volume observations shows that sea ice looks set to disappear in 2019, while disappearance in 2015 is within the margins of a 5% confidence interval, reflecting natural variability. In other words, extreme weather events could cause Arctic sea ice to collapse as early as 2015, with the resulting albedo changes further contributing to the acceleration of warming in the Arctic and causing further methane eruptions from the seafloor of the Arctic Ocean.

click on image to enlarge
As the Arctic continues to warm, the temperature difference between the equator and the Arctic declines, resulting in changes to the jet streams and polar vortex.

One such change is a slowing down of the speed at which the jet streams and polar vortex circumnavigate the globe, as discussed in a recent post.

The image on the right shows that the jet streams on the Northern Hemisphere reached speeds as high as 410 km/h (255 miles per hour) on January 9, 2015. Also note the jet stream crossing the Arctic Ocean, rather than staying between 50 and 60 degrees latitude, where the polar jet streams used to be.

The image below shows winds on January 11, 2015, at several altitudes, i.e. at 10 hPa | ~26,500 m (16.5 mile), high in stratosphere, polar vortex (left, at 250 hPa | ~10,500 m (6.5 mile), jet stream (center), and at 700 hPa | ~3,500 m (2.2 mile), high in planetary boundary layer.

click on image to enlarge
As a result, extreme weather events such as heatwaves and storms can be expected to occur with greater frequency and intensity, as also discussed in a recent post. Heatwaves can heat up the water in the North Atlantic, as it flows into the Arctic Ocean, driven by the Gulf Stream, while heatwaves can also warm up the water in rivers that end up in the Arctic Ocean. Heatwaves can also hit the sea ice in the Arctic Ocean directly, causing rapid sea ice melting, while storms can make the ice break up and be driven out of the Arctic ocean,

Demise of the sea ice and snow cover in the Arctic results in further acceleration of warming, not only due to less sunlight getting reflected back into space, but also due to loss of the buffer that currently absorbs huge amounts of heat as it melts in summer. With the demise of this latent heat buffer, more sunlight will instead go into heating up the water of the Arctic Ocean. For more on the latter, see the page on latent heat.


Above image illustrates some of the self-reinforcing feedback loops that have been highlighted in this and earlier posts. Further feedbacks are pictured in the image below.

from the Feedbacks page
Runaway Global Warming

Above feedbacks are already pushing the temperature rise in the Arctic through the 2°C guardrail.


Based on existing temperature data, global warming on land looks set to exceed 2°C (3.6°CF) warming by the year 2034, but methane eruptions from the seafloor of the Arctic Ocean could push up global temperature rise even faster, in a runaway global warming scenario.

click to enlarge image
This raises the specter of human extinction. With no action taken, there appears to be a 55% risk that humans will be extinct by the year 2045, while taking little action will only postpone near-term human extinction by a few years. Only with rapid implementation of comprehensive and effective action may we be able to avoid this fate.


Comprehensive and Effective Action

In conclusion, the situation is dire and calls for comprehensive and effective action, as discussed at the Climate Plan blog at climateplan.blogspot.com and as illustrated by the image below.


Tuesday, January 6, 2015

Edge of Extinction

Guy McPherson
Guy McPherson is convinced that humunity will go extinct soon. Guy estimates that it will happen in 5 to 20 years time.

In the video below, Guy discusses a chain of events causing several degrees warming within a few years time, including failure of the electric grid and subsequent fall in aerosols from fossil fuel burning that now mask warming, and failure to maintain nuclear power plants cooling, causing them to melt down.

These events will cause rapid warming that will accelerate loss of the snow and sea ice in the Arctic and cause massive methane releases from the seafloor of the Arctic Ocean, both adding even further warming.

Such massive warming will result in widespread crop failure and loss of habitat for humans over a timespan of up to 20 years, while events could all unfold in just 5 years time.

In the video below, Guy discusses that we are on the edge of extinction, episode 1.


Feedbacks
 

Professor Peter Wadhams on albedo changes in the Arctic

Conclusion from a paper presented at the 2008 EGU conference, on background
of a frame from a video interview by Nick Breeze with Natalia Shakhova.


In the video below, episode 2, Guy describes how large releases of methane from the seafloor of the Arctic Ocean alone could end civilization, as they will cause crop failure on the Northern Hemisphere and subsequent collapse of civilization. This will in turn cause failure of the electric grid, etc., as described above. So, whatever event comes first, it will trigger the other events, resulting in several degrees Celsius warming within years and loss of habitat for humans.


The image below highlights some of the complexities associated with the necessary cuts in emissions, including the impact of aerosols that mask the full wrath of global warming by half. In 2007, the IPCC described aerosols as a negative (cooling) force equal to between -0.5 and -2.5 W m-2. In 2009, Murphy et al suggested an aerosol forcing about -1.5 W m-2, reducing the net climate forcing of the past century by about half. In 2011, Hansen et al, based mainly on analysis of Earth's energy imbalance, derived an aerosol forcing -1.6 ± 0.3 W m-2. [source] As David Spratt points out, this equates to a cooling of about 1.2°C. In other words, abrupt ending of aerosols emissions would result in a temperature rise of about 1.2°C in a matter of weeks.


In the video below, Guy McPherson further discusses the impact of aerosols.


Below, 'Edge of Extinction', episode 3, published on 15 January, 2015, featuring Guy McPherson in a fine moment of comedy! Excerpt from his presentation at Butte College, November 20, 2014, Chico, California.


Below, 'Edge of Extinction', episode 4, published on 21 January, 2015, in which Guy comments on the State of the Union address of January 20, 2015.


Below, 'Edge of Extinction', episode 5, published on 27 Jan 2015, featuring an excerpt from Guy McPherson's interview on Global Research December 12, 2014 on the stages of grief. 


Follow Guy McPherson's European Trip March/April 2015


Thursday, August 15, 2013

Arctic Sea Ice in Free Fall

Arctic Sea Ice has declined dramatically recently. The recent image below, by the Danish Meteorological Institute, shows the decline in extent over the past few days, with extent calculated by including all areas with ice concentration higher than 30%.


As the above image shows, sea ice extent (30%+ concentration) is now lower than any other year, except 2007 and 2012. Moreover, the sharp decline looks set to continue.

Ice volume and concentration have dropped dramatically, partly as a result of the cyclone that hit the Arctic Ocean a few days ago. The eye of the cyclone is still visible almost exactly above the North Pole on the Naval Research Laboratory image below on the right, where sea ice concentration appears to form a circle.

The sea ice looks set for an all-time record low; all this thin ice looks set to disappear over the next few weeks.

The graph below, also by the Danish Meteorological Institute, calculates sea ice extent by including all areas with 15% or more ice concentration.
The above graph also shows a steep recent descent, although not as pronounced as in the graph at the top that includes spots with 30% or more ice concentration. The graph at the top better illustrates recent drops in ice concentration from, say, 40% to 20%, which can occur quite abruptly due to the impact of a cyclone. 

The Danish Meteorological Institute has meanwhile produced a more recent version of the graph based on spots with 30% or more ice concentration (added below).


The above graph shows an August 15 extent that appears to be back in line with the earlier trend. At first glance, it may appear as if the sea ice has largely recovered from the impact of three cyclones that have hit the Arctic Ocean over the past two months. 

However, these cyclones are likely to have contributed to the appearance and persistence of thin spots in the ice close to the North Pole. This phenomenon was earlier described in posts such as Thin Spots developing in Arctic Sea Ice

The conclusion remains the same as the one drawn then in that post, i.e. that for years, observation-based projections have been warning about Arctic sea ice collapse within years, with dire consequences for the Arctic and for the world at large.

Cyclones can speed up this collapse. On this point, it's good to remember what Prof. Peter Wadhams said in 2012:
". . apart from melting, strong winds can also influence sea ice extent, as happened in 2007 when much ice was driven across the Arctic Ocean by southerly winds (not northerly, as she stated). The fact that this occurred can only lead us to conclude that this could happen again. Natural variability offers no reason to rule out such a collapse, since natural variability works both ways, it could bring about such a collapse either earlier or later than models indicate.

In fact, the thinner the sea ice gets, the more likely an early collapse is to occur. It is accepted science that global warming will increase the intensity of extreme weather events, so more heavy winds and more intense storms can be expected to increasingly break up the remaining ice, both mechanically and by enhancing ocean heat transfer to the under-ice surface."
Hopefully, more people will realize the urgency of the situation and realize the need for a comprehensive and effective plan of action as described here.

Friday, August 9, 2013

Toward Genuinely Improved Discussions of Methane & Climate

The post 'Toward Improved Discussions of Methane & Climate' recently appeared at SkepticalScience, in response to the recent publication in Nature of 'Vast Costs of Arctic Change', by Gail Whiteman, Chris Hope, and Peter Wadhams.

Below are Paul Beckwith's comments that were recently submitted at that post. The text by SkepticalScience is in italics. Paul's comments are in red.


SkepticalScience: “Here at Skeptical Science, there is an ongoing effort to combat disinformation from those who maintain that climate change is a non-issue or non-reality. From time to time, however, individuals or groups overhype the impacts of climate change beyond the realm of plausibility. Some of this is well-intentioned but misguided. For those who advocate climate literacy or for scientists who engage with the public, it is necessary to call out this stuff in the same manner as one would call out a scientist who doesn’t think that the modern CO2 rise is due to human activities.

Many overblown scenarios or catastrophes seem to involve methane in the Arctic in some way. There are even groups out there declaring a planet-wide emergency because of catastrophic, runaway feedbacks, involving the interplay between high latitude methane sources and sea ice.”


Paul Beckwith: The above two paragraphs set the tone of this discourse. AMEG (Arctic Methane Emergency Group) is unjustly framed in this introduction as a fringe group using such terms as “overhype”, “beyond realm of plausibility”, “overblown scenarios or catastrophes”, “planet-wide emergency”. This is the complete opposite of the truth. AMEG was founded based on a meeting in October, 2011 in the U.K. and I joined in December, 2011. We are a group of concerned professionals with a varied background including climate scientists, engineers, doctors, moviemakers, economists, journalists.

We have studied the Arctic, methane, sea ice, and climate change as a group since that time, and individually for much longer. We base our work and analysis on observations, not on models.

The facts on the ground and ocean in the Arctic region speak for themselves. The PIOMAS work, which has been substantiated independently by CryoSat satellite data, show that the sea ice volume is trending downwards exponentially and if that trend continued would reach zero around 2015 or 2016. Trending down even faster is the May and June Arctic snow cover, as measured clearly by Rutgers data. Methane levels in the Arctic have increased significantly over the last several years. In fact, the mainstream scientific viewpoint was that the seafloor over the ESAS (Eastern Siberia Arctic Shelf) was impermeable to methane outgassing. Then Shakhova, Yurganov, and other Russian scientists measured outgassing plumes tens of meters in diameter one year expanding to kilometers in diameter the very next year. Flask measurements in Barrow, Alaska and Svalbaard indicated local levels of >2100 ppb and AIRS satellite measurements over the last decade have shown greatly increase levels of methane in the last few years. This is all observation, and not modeled by anybody. In fact, higher methane emissions have been reported along the Arctic coastlines, presumably from enhanced wave action due to larger wave action from the increased ice-free ocean.

Also, higher emissions have been measured elsewhere from continental shelves, for example off the east coast of North America from warm Gulf Stream water that has shifted eastward over the shelves, warming ocean temperatures several degrees.

Thus, the “radical” or “fringe” or “out-there” view is not from AMEG, quite the opposite. Based on the precautionary principle, it is imperative that so called “mainstream” science examine this data without preconceptions that it takes centuries or millennia for methane to outgas. It is unfathomable to AMEG and many others that main-stream science are behaving like “methane denialists” when the observations are clearly undermining such out-of-hand rejection, based on inaccurate models that are clearly missing feedbacks. In fact the situation is so ridiculous that the IPCC is not even considering methane as a strong feedback in their next report.

People on the street are now recognizing that the weather extremes are moving off the charts in terms of frequency, severity, and spatial extent (mostly for extensive long duration droughts, and also torrential rains causing floods). They are starting to recognize that the collapse in Arctic albedo from declining snow cover and sea ice loss is greatly amplifying the warming in the Arctic. This obviously lowers the temperature gradient between the equator and North Pole which via simple physical laws slows the jet streams making them wavier and stickier. This changing global circulation, combined with 4% higher water vapor in the atmosphere is causing these weather extremes.

Things are happening that have never been observed before in human history. Like the rate of decline of sea ice and snow cover, the extensive cracking of sea ice this March-2013, the “hole” forming near the north pole from relatively weak cyclones, the massive, long duration cyclone at the beginning of August-2012, and the list goes on and on. AMEG being extreme? Hardly, more like science compartmentalization and specialization being myopic to the collection of system changes that are screaming out that the climate system has entered a period of abrupt change that has not been seen before in human history, but has happened many times in the paleorecords. In fact, rates of change now are at least 10x higher than any seen in the geologic record.


SkepticalScience: About a week ago, a Nature article by Gail Whiteman, Chris Hope, and Peter Wadhams came out analyzing the "Vast Costs of Arctic Change." The Whiteman article is an honest and thoughtful commentary about the economic impacts of a changing Arctic climate. I will not comment on their economic modeling here, but rather on a key scenario assumption that they use which calls for vast increases in Arctic-sourced methane to the atmosphere. In this case, they have in mind a very rapid pulse of 50 Gigatons of methane emanating from the East Siberian Shelf (see image, including Laptev and East Siberian sea). Note: 1 GtCH4= 1 Gigaton of methane = 1 billion tons of methane. Whiteman et al. essentially assume that this "extra methane" will be put in the atmosphere on timescales of years or a couple decades. This article has been widely publicized because it calls for an average of 60 trillion dollars on top of all other climate change costs. Since this was discussed in a prediction context rather than as a thought experiment, it demands analysis of evidence.

In this article, I will argue that there is no compelling evidence for any looming methane spike. Other scientists have spoken out against this scenario as well, and I will encompass some of their arguments into this piece. In summary, the reason a huge feedback is unlikely is because of the long timescale required for global warming to reach some of the largest methane hydrate reservoirs (defined later) 
(Paul Beckwith: no methane was expected from ESAS since seafloor was thought to be impermeable, until it was measured to rapidly outgas from one year to the next), and because no evidence exists for such an extreme methane concentration sensitivity to climate in the past record (Paul Beckwith: methane pulses released over several years or a few decades is not detectable in ice cores since bubble closure below firn takes about 50 years or more).Permafrost feedbacks are of concern, but there is no basis for assuming a dramatic "tipping point" in the atmospheric methane concentration (Paul Beckwith: no basis for this statement since observations show large increase in methane).

The Methane Tour

Methane (CH4) is a greenhouse gas. It absorbs thermal energy that the Earth is trying to shed into outer space, and can thus warm the surface of the planet. Its concentration in the modern atmosphere is a little bit shy of 2 parts per million by volume (ppm), compared to roughly 0.72 ppm in 1750 or 0.38 ppm in typical glacial conditions. Like CO2, methane has not risen to modern day concentrations during the entirety of the now ~800,000 year long ice core record.

So what about Whiteman's scenario?

For perspective on how big 50 GtCH4 is, I've used data from David Archer's online methane model to see how atmospheric methane concentrations would change in response to such a big carbon injection. You can do this as a back-of-envelope calculation by noting that 1 ppm is about 2.8 GtCH4 if it all stays as methane and isn't removed, but this model lets you see the decay timescale too. For methane, the decay back to original concentrations occurs within decades, whereas for CO2 it takes millennia (CH4 is rapidly oxidized by the hydroxyl radical in the atmosphere). Therefore, CO2 dominates the long-term climate change picture but the methane spike can induce very large transitory effects.
(Paul Beckwith: keep in mind that the methane lifetime varies greatly depending on the availability of the hydroxyl radical. On average it is 12 years, however in dry regions like the Arctic with little water vapor it is longer, while at moist equatorial regions it is shorter).

I've run two scenarios in which the 50 GtCH4 injection takes 1 year and 10 years to complete (red and blue lines, respectively). The model starts with pre-industrial CH4 concentrations in years -10 through zero. The modern concentration of methane is shown as a horizontal orange line.


Everything having to do methane in the ice core record resides below the orange line in Figure 1 (at least within the resolution of the cores). So we're potentially talking about a very big change, which the Whiteman article contends is likely to be emitted fairly soon and should have implications for Arctic policy. (Paul Beckwith: This graph clearly demonstrates that if glacial ice bubble closure takes 50 years, then the pulse will not be captured. Also, the molecular weight of CH4 is 16 compared to 30 or so for air (mostly N2) so the methane does not stay around the surface for long).

For many, the primary concern about “big” abrupt changes in atmospheric CH4 stems from the large quantity of CH4 stored as methane hydrate or in permafrost in the Arctic region. These terms are defined below. It should be noted that globally, wetlands are the largest single methane source to the modern atmosphere. Most of that contribution is from the tropics and not from high latitudes (even if the Arctic was to start pumping harder). The Denman et al., 2007 carbon cycle chapter in the last IPCC report is a useful reference. (Paul Beckwith: methane from wetlands in tropics has short lifetime due to extremely large quantities of water and thus hydroxyl ions in that region, as opposed to methane from the Arctic in much drier conditions)

Nonetheless, the Arctic is a region that is quite dynamic and is changing rapidly. The high latitudes are currently a CO2 sink (Paul Beckwith: this cannot be correct, since CO2 concentrations are higher in the Arctic than the global values measured at Mauna Loa, for example) and CH4 source in the modern atmosphere, and it’s not implausible that the effectiveness of the sink could diminish (or reverse) or that the methane source could enhance in the future, since we expect a transition to a warmer, wetter climate with an extended thawing season. This makes the carbon budget in the Arctic a “hot” place for research.

In these discussions, it is important to clarify what sort of methane source we're talking about.

Methane hydrate is a solid substance that forms at low temperatures / high pressures in the presence of sufficient methane. It is an ice-like substance of frozen carbon, occurring in deep permafrost soils, marine continental margins, and also in deeper ocean bottom sediments. It's also very concentrated (a cubic foot of methane hydrate contains well over 100 times the same volume of methane gas).

On the decade-to-century timescale, the liberation of methane from the marine hydrate reservoir (or the deep hydrates on land) should be well insulated from anthropogenic climate change. Deep ocean responses by methane are a very slow response (many centuries to millennia, Archer et al., 2009). Methane released in deep water also needs to evacuate the water column and get to the atmosphere in order to have a climate impact, although much of it should get eaten up by micro-organisms before it gets the chance. These issues are discussed in a review paper by O’Connor et al., 2010.
(Paul Beckwith: Methane response in deep ocean is not always slow, thus this section is very misleading. Underwater landslides from slope instability or earthquakes are know to have resulting in large methane pulses many times in the paleorecords. For example, Storegga off Norway or off New Zealand, there are extensive pockmarks on the ocean floor indicating abrupt episodic events. The mainstream view that methane outgassing from deep water regions does not enter the atmosphere. If release is slow that is correct, however rapid outbursts overwhelm the micro-organisms and result in large amounts of methane entering the atmosphere. Even slower releases from deep water off Svalbard have been observed recently to enter the atmosphere; another unexpected development).

There’s also carbon in near-surface permafrost, which is the more vulnerable carbon pool during this century. Permafrost is frozen soil (perennial sub-0°C ground), and can also encompass the sub-sea permafrost on the shelves of the Arctic Ocean. This includes the eastern Siberian shelf, a very shallow shelf region (only ~10-20 m deep, and very broad, extending a distance of 400– 800 km from the shoreline). This is a bit of a special case. These subsea deposits formed during glacial times, when sea levels were lower and the modern-day seafloor was instead exposed to the cold atmosphere. The ground then became submerged as sea levels rose (going into the warmer Holocene). The rising seas have been warming the deposits for thousands of years. Because of their exposure during the Last Glacial Maximum, the shelves may be almost entirely underlain by permafrost from the coastline all the way down to a water depth of tens or even a hundred meters (e.g., Rachold et al., 2007 and this USGS page).

There's actually no good evidence of shallow hydrate on the Siberian shelves, even though there are substantial quantities of subsea permafrost. Hydrate may exist deeper down however, more than 50 meters below the seafloor. The stability of these hydrates is sustained by the existence of permafrost, and it's not quite clear to what extent hydrate can also be stored within the permafrost layer.
(Paul Beckwith: Permafrost people have an over-reliance on uniform slab models which examine time taken for heat to propogate through the slabs to melt the deep permafrost. They severely underestimate the fracturing and nonuniform nature of the permafrost, presence of taliks, etc. All that is needed is one weak spot or fracture region and heat can transfer downward much faster and further than the models suggest. Similar slab models are used to estimate glacial ice melting and they have clearly been incorrect and completely underestimate the rates of melting from dynamic effects and Moulin pathways, for example.)

The estimates of the amount of methane in these various Arctic reservoirs are very uncertain. Ballpark numbers are a couple thousand gigatons of carbon (GtC) stored in hydrates in global marine sediments (e.g., Archer et al., 2009) of which a couple hundred gigatons of carbon are in the Arctic Ocean basin, and between 1000-2000 GtC in permafrost soil carbon stocks (e.g., Tarnocai et al., 2009) after you include the deeper deposits. For comparison, there is a bit over 800 GtC in the atmosphere, of which about 5 Gt is in the form of methane, and estimated ~5000 GtC in the remaining fossil fuel reserve. These numbers seem big compared to the atmosphere, but for methane direct comparison isn't too relevant unless you put it in rapidly, since it has such a short lifetime in the atmosphere. Large amounts of CO2, in contrast, last much longer.

A couple years ago, Shakhova et al. (2010a) reported extensive methane venting in the eastern Siberian shelf and suggested that the subsea permafrost could become unstable in a future warmer Arctic. Shakhova et al (2010b) cite ~1400 Gt in the East Siberian Arctic Shelf, which comprises ~25% of the Arctic continental shelf and most of the subsea permafrost. Shakhova et al (2010c) ran through a few different pathways in which they argued for 50 GtCH4 release to the atmosphere either in a 1-5 year belch or over a 50-yr smooth emission growth, which they suggest, “significantly increases the probability of a climate catastrophe.” This assessment was the foundation for the concern in the recent Whiteman Nature article, linked at the top.

The physical mechanism outlined by some of these authors is related to the rapid reduction in Arctic summer sea ice observed over the last few decades, which allows for greater amounts of solar radiation to penetrate the waters around the Arctic shelf. Warming water propagates down in the well-mixed layers tens of meters to the seabed, and might melt frozen sediments underneath. Because the shelf in this region is shallow (compared to other regions), one doesn't need to wait a long time for the seafloor to feel the atmosphere-surface forcing, and methane leakage might have an easier escape path to the atmosphere. Allegedly, this has been leading to an acceleration of methane flux.


Responses from Scientists

As a response to the first paper from Shakhova on enhanced methane fluxes, Petrenko et al (2010) criticized the authors for misunderstanding several of their references and primarily for the logical implications of their conclusions. For example,
“A newly discovered CH4 source is not necessarily a changing source, much less a source that is changing in response to Arctic warming. Shakhova et al. do acknowledge these distinctions, but in these times of enhanced scrutiny of climate change science, it is important to communicate all evidence to the scientific community and the public clearly and accurately”
(Paul Beckwith: Examination of the methane concentrations in the atmosphere in the Arctic region from AIRS satellite data over a decade or so shows an obvious large increase in the amount of methane, and has been corroborated with flask measurements at locations across the Arctic, namely Barrow, Alaska and Svalbard. How is this not a changing source?)

Another paper, Dmitrenko et al (2011) reinforced this statement and came to the conclusion that there is currently no evidence that Arctic shelf hydrate emissions have increased due to global warming. This is also discussed in the review article by O'Connor et al (2010, linked above). (Paul Beckwith: Again, does one trust a direct observation or a conclusion from a paper? Obviously the direct observation.)

The work done by the Dmitrenko paper shows that although the changing Arctic atmosphere has led to warmer temperatures throughout the water column (over the eastern Siberian shelf coastal zone), it takes a very long time for the permafrost feedback at the bed to respond to this signal. They noted that the deepening of the permafrost table should only have been on the order of 1 meter over the last several decades, which does not permit a rapid destabilization of methane hydrate.  (Paul Beckwith: Deepening of the permafrost table of 1 meter over several decades is based on a slab model and let to the erroneous mainstream view that the seafloor over the ESAS was impermeable to methane release. Measurements show otherwise.)

It is important to emphasize that simple point source emission estimates are not often suitable for determining changed sources and sinks over the last few decades, and thus don't tell you how that translates into atmospheric concentration. This should be kept in mind when seeing dramatic videos of methane venting from a shelf or exploding lake, which might not actually have much to do with global warming. (Paul Beckwith: This is a very alarming view, and would fit in fine on any of numerous climate denial websites. Rapid methane emissions in the Arctic are what they are. Call a spade a spade.)

In 2008, there was a comprehensive report on Abrupt Climate Change from the U.S. Climate Change Science Program, which is a bit dated but nonetheless makes a statement reflecting most of current scientific thinking. Quoting Ch. 5 Brook et al (2008):
"Destabilization of hydrates in permafrost by global warming is unlikely over the next few centuries (Harvey and Huang, 1995). No mechanisms have been proposed for the abrupt release of significant quantities of methane from terrestrial hydrates (Archer, 2007). Slow and perhaps sustained release from permafrost regions may occur over decades to centuries from mining extraction of methane from terrestrial hydrates in the Arctic (Boswell, 2007), over decades to centuries from continued erosion of coastal permafrost in Eurasia (Shakova [sic] et al., 2005), and over centuries to millennia from the propagation of any warming 100 to 1,000 meters down into permafrost hydrates (Harvey and Huang, 1995)" (Paul Beckwith: Again, slab model thinking. Episodic events like landslides negate these claims, as does fractures and other weakspots in the slabs which allow pathways for huge heatflow. A good analogy is polyanas in sea ice that allow for enormous heat flow between the ocean and the atmosphere in a sea ice field.)
Paleo-Analogs

One of the primary reasons we don't think there's as much methane sensitivity to warming as has been proposed by Shakhova, and argued for in the Whiteman Nature article, is because there's no evidence for it in the paleoclimate record.  This has been a point made by Gavin Schmidt on Twitter (a compilation of his many tweets on the topic here) but the objections to the Nature assumptions have been further echoed in recent days by other scientists working on the Arctic methane issue (e.g., here, here).

One can argue from a process-based and observations-based approach that we don't understand everything about Arctic methane feedback dynamics, which is fair. Nonetheless, the methane changes on the scale being argued by Whiteman et al. should have been seen in the early Holocene (when Summer Northern Hemispheric solar radiation was about 40 W/m2 higher than today at 60 degrees North, 7000-9000 years ago). (Paul Beckwith: Earth tilt was larger, so Winter Northern Hemispheric solar radiation was about 40 W/m2 lower than today at 60 degrees North. Thus, the ice formed much more quickly and much thicker in the winter back then. Also, at night much more heat was radiated out to space in the lower GHG world then as compared to our 400 ppm levels today). Even larger anomalies occurred during the Last Interglacial period between 130,000 to 120,000 years ago, though with complicated regional evolution (Bakker et al., 2013). 

Both of these times were marked by warmer Arctic regions in summer without a methane spike. It's also known pretty well (see here) that summertime Arctic sea ice was probably reduced in extent or seasonally free compared to the modern during the early Holocene, offering a suitable test case for the hypothesis of rapid, looming methane release. (Paul Beckwith: Incorrect, the summertime Arctic is not believed to be seasonally ice free during these periods. The last time this happened was likely 2 or 3 million years ago.)

It should be noted that Peter Wadhams did offer a response recently to the criticisms of the Whitehead Nature piece (Wadham is a co-author) but did not address why this idea has not been borne out paleoclimatically.

Yesterday, an objection to the paleoclimate comparison cropped up in the Guardian suggesting that the early Holocene or Last Interglacial analogs are not suitable pieces of evidence against rapid methane release. They aren't perfect analogs, but the argument does not seem compelling. (Paul Beckwith: Colder winters in the early Holocene and Last Interglacial and much colder nights (in summers and winters then) meant much thicker and extensive ice formation in winters, and slower melting at night, respectively. Compelling arguments.) The Northeast Siberian shelf regions have been exposed many times to the atmosphere during the Pleistocene when sea levels were lower (and not covered by an ice sheet since at least the Late Saalian, before 130,000 years ago, e.g., here). As mentioned before, when areas such as the Laptev shelf and adjacent lowlands were exposed, ice-rich permafrost sediments were deposited. The deposits become degraded after they are submerged (when sea levels increase again), resulting in local flooding and seabed temperature changes an order of magnitude greater than what is currently happening. Moreover, the permafrost responses have a lag time and are still responding to early Holocene forcing (some overviews in e.g., Romanovskii and Hubberten, 2001; Romanovskii et al., 2004; Nicolsky et al., 2012). A book chapter by Overduin et al., 2007 overviews the history of this region since the Last Glacial Maximum. These texts also suggest that large amounts of submarine permafrost may have existed going back at least 400,000 years. It therefore does not seem likely that the seafloor deposits will be exposed to anything in the coming decades that they haven't seen before. (Paul Beckwith: What is unique now is the extremely high concentration levels of CO2 (400ppm) and CH4 (>1900ppb). These high concentrations trap the heat in the troposphere 24/7. Thus, at night heat loss is limited by the GHG blanket. At all previous times the GHG blanket was much weaker, with CO2 ranging from 180 to 280 ppm and CH4 ranging from 350 to 700 ppb, or so. This makes an enormous difference.)

What about other times in the past? Fairly fast methane changes did occur during the abrupt climate change events embedded within the last deglaciation (e.g., Younger Dryas), just before the Holocene when the climate was still fluctuating around a state colder than today. These CH4 changes were slower than the abrupt climate changes themselves, and have been largely attributed to tropical and boreal wetland responses rather than high latitude hydrate anomalies. Marine hydrate destabilization as a major driver of glacial-interglacial CH4 variations has also been ruled out through the inter-hemispheric gradient in methane and hydrogen isotopes (e.g., Sowers, 2006(Paul Beckwith: Episodic events like landslides, as mentioned before, cannot be discounted. In fact geological events like landslides occur at much higher frequencies when there is a rapid temperature transition, as covered extensively in Bill McGuire’s new textbook. Also, the text on “The Clathrate Gun hypothesis” cannot be completely discounted.)

To be fair, we don't have good atmospheric methane estimates during warmer climates that prevailed beyond the ice core record, going back tens of millions of years. Methane is brought up a lot in the context of the Paleocene-Eocene Thermal Maximum (PETM, 55 million years ago). During this time, proxy records show global warming at the PETM (similar to what modern models would give for a quadrupling of CO2), extending to the deep ocean and lasting for thousands of years. In addition, there were substantial amounts of carbon released. It may very well be that isotopically light carbon came from a release of some 3,000 GtC of land-based organic carbon, rather than a destabilization of methane hydrates, although this is a topic of debate and ongoing research (see e.g., Zeebe et al., 2009; Dickens et al., 2011).

It's also important to emphasize that any destabilization of oceanic methane hydrates at the PETM, or any other time period, would imply that the carbon release is a feedback to some ocean warming that occurred first- perhaps on the order of 1000 years beforehand. Furthermore, once methane was in the atmosphere, it would oxidize to CO2 on timescales significantly shorter than the PETM itself (decades.) Unfortunately, there is no bullet-proof answer right now for what caused the PETM, but rather several hypotheses that are consistent with proxy interpretation. However, methane cannot be the only story.

The Role of Methane in Climate (Change)

To be clear, CH4 is important as we go forward, and is already a key climate forcing agent behind CO2 (coming in at ~0.5 W/m2 radiative forcing since pre-industrial times). Additionally, methane is quite reactive in the atmosphere, and the effect of other things like tropospheric ozone, aerosols, or stratospheric water vapor are partly slaved to whatever is happening to methane (Shindell et al., 2009). This means methane emitted has a bigger collective impact on climate than if you just do the radiative forcing calculation by comparing methane concentration changes to what it was in 1750.
 (Paul Beckwith: It is important to point out an enormous misconception in public and scientific reports on methane regarding the Global Warming Potential (GWP). A number in the low 20s is almost always reported (22x, 25x…) and is based on a 100 year timescale. On a 20 year timescale, methane GWP is around 70x, and on a 1 or 2 year timescale the GWP is >150x. Clearly, in terms of methane in the Arctic sourced from marine or terrestrial permafrost the number of significance to sea ice and localized warming is 150x.)

Permafrost thawing is also going to be important in the coming century (this is a good paper), and the uncertainties pretty much go one way on this. There's not much wiggle room to argue that permafrost will reduce CH4/CO2 concentrations in the future. This is also likely to be a sustained release rather than one big catastrophic event. For example, permafrost was not included in Lenton (2008) as a "tipping point" for precisely the reason that there's no evidence for any "switch" of rapid behavior change. (Paul Beckwith: Exclusion of methane as a “tipping element” in this paper by the “experts” in 2008 was based on rates of change based on slab models, which recent observations of emissions has clearly invalidated). Much of the carbon is also likely to be in the form of CO2 to the atmosphere, and even implausible thought experiments of catastrophic methane release (see David Archer's post at RealClimate) give you comparable results in the short-term as to what CO2 is going to do for a long time.

Conclusion

The observed methane venting from the East Siberian shelf sea-floor to the atmosphere is probably not a new component of the Arctic methane budget. Furthermore, warming of the Arctic waters and sea ice decline will likely impact subsea permafrost on longer timescales, rather than the short term. (Paul Beckwith: Is this author so sure of this as to be willing to stake the stability/instability of the entire global circulation system on this?)

Methane feedbacks in the Arctic are going to be important for future climate change, just like the direct emissions from humans. This includes substantial regions of shallow permafrost in the Arctic, which is already going appreciable change. Much larger changes involving hydrate may be important longer-term. Nonetheless, these feedbacks need to be kept in context and should be thought of as one of the many other carbon cycle feedbacks, and dynamic responses, that supplement the increasing anthropogenic CO2 burden to the atmosphere. There is no evidence that methane will run out of control and initiate any sudden, catastrophic effects. (Paul Beckwith: There is no evidence that methane will not run out of control, in light of large increases of concentrations in recent years).  There's certainly no runaway greenhouse. Instead, chronic methane releases will supplement the primary role of CO2. Eventually some of this methane oxidizes into CO2, so if the injection is large enough, it can add extra CO2 forcing onto the very long term evolution of global climate, over hundreds to thousands of years.


Errata Update SkepticalScience: Gavin Schmidt let me know that in the first version of this post, I used gigatons of carbon instead of gigatons of methane. I mistakingly read the Shakhova paper as an injection of carbon. Since the molecular weight of carbon is 12 g/mol, and CH4 is 16 g/mol, then 1 GtC=1.33 GtCH4. The figure in the post has been revised accordingly and doesn't impact the argument here.


Related

- Arctic Methane Release: "Economic Time Bomb"
http://arctic-news.blogspot.com/2013/07/arctic-methane-release-economic-time-bomb.html

- Methane Hydrates
http://methane-hydrates.blogspot.com/2013/04/methane-hydrates.html

- Arctic Methane FAQ
http://arcticmethane.blogspot.com/p/faq.html


- Listen to Paul Beckwith speak on Gorilla-radio.com
http://www.gorilla-radio.com/audio/Gorilla_Radio_2012-2013-08-13-24647.mp3