Friday, August 31, 2012

Paul Beckwith on ice speed and drift - update 1


Above image shows Arctic sea ice extent (total area of at least 15% ice concentration) for the last 7 years, compared to the average 1972-2011, as calculated by the Polar View team at the University of Bremen, Germany.

View Paul Beckwith's August 30 presentation on sea ice speed and drift by clicking on the following link:
https://docs.google.com/file/d/0ByLujhsHsxP7VTlsczIyalpjNDQ/edit


Or, view the presentation in the window below (it may take some time for the file to fully load).


Two earthquakes off the coast of Jan Mayen Island

Two earthquakes struck the waters off the coast of Jan Mayen Island on August 30, 2012. One had  a magnitude of 6.8 on the Richter Scale and occurred at 13:43 pm (UTC), and was followed eight minutes later by a second one with a magnitude of 5.2 on the Richter Scale that took place on 13:51 pm (UTC).

The location of the earthquakes is indicated by the blue square on the top left of the USGS map below.


The Google map below shows that the location is on fault line extending north into the Arctic Ocean.


The map below shows the two earthquakes at the top in orange. The map shows all earthquakes with a magnitude 5.0 or higher that happened worldwide from August 1 to 30, 2012.


The largest earthquake in August 2012 was a magnitude 7.7 quake on August 14 in the Sea of Okhotsk, close to Sakhalin, Russia's largest island.  With a depth of 626 km (389 miles), it was a "deep-focus" earthquake. Such quakes can be felt at great distance from their epicenters.

As the above map shows, this 7.7 M earthquake and the two recent ones off the coast of Jan Mayen Island occurred on the same fault line that goes over the Arctic. The danger is that further earthquakes on this fault line could destabilize methane hydrates in the Arctic, triggering release of huge amounts of methane.

The map below, from this page, shows fault lines and elevation in meters.


In 2011, a number of posts were added on this topic at knol, which has meanwhile discontinued. These posts have been preserved at the following pages:
Methane linked to Seismic Activity in the Arctic
Runaway warming
Thermal expansion of the Earth's crust necessitates geoengineering


Wednesday, August 29, 2012

Arctic sea ice area already shrank by over 81 percent this year


Arctic sea ice area already shrank by over 81% this year.

Arctic sea ice area was 13.70851 million square km on the 88th day of 2012, as illustrated on the image below by The Cryosphere Today.  The image further below shows that only 2.59449 million square km was left of Arctic sea ice area on the 238th day of 2012. In other words, less than 19% is left of the sea ice area there was earlier this year.

And there's still quite a few days to go in the melting season.


Tuesday, August 28, 2012

Arctic Sea Ice Collapse Food Emergency

Arctic Sea Ice Collapse Food Emergency
a video by Peter Carter of
ArcticClimateEmergency.com


Diagram of Doom


Above diagram was part of a poster displayed at the 2011 AGU meeting in San Francisco by the Arctic Methane Emergency Group (AMEG). It was accompanied by the following text: In the Arctic, three problems are compounding one another: emissions causing global warming, sea ice loss causing accelerated warming, and methane releases further accelerating Arctic warming, with the danger of triggering runaway global warming.

The diagram pictures three kinds of warming and their main causes:
  1. Emissions by people causing global warming, with temperatures rising around the globe, including the Arctic.
  2. Soot, dust and volatile organic compounds settling down on snow and ice, causing albedo change. More heat is absorbed, rather than reflected as was previously the case. This causes accelerated warming in the Arctic.
  3. Accelerated warming in the Arctic threatening to weaken methane stores in the Arctic with the danger that methane releases will trigger runaway global warming.

The diagram also pictures two feedback effects that make things even worse:
  • Albedo feedback: Accelerated warming in the Arctic speeds up sea ice loss, further accelerating albedo change.
  • Methane feedback: Methane releases in the Arctic further add to the acceleration of warming in the Arctic, further contributing to weaken Arctic methane stores and increasing the danger that methane releases will trigger runaway global warming.

Albedo change in the Arctic comprises a number of elements, as depicted in the image below, from the 2004 report Impacts of a Warming Arctic - Arctic Climate Impact Assessmentby the International Arctic Science Committee.  


As described in various posts at this blog over time, there are further points that should be taken into account. Regarding sea ice loss, it's clear that where sea ice retreats, more open water appears, with the result that less sunlight is reflected back into space. Accelerated warming will also affect the integrity of the remaining sea ice, as well as of the snow and ice cover on land, including glaciers. This further adds to the albedo effect, causing less sunlight to be reflected back into space. Similarly, further feedbacks could be added or described in more detail.

Accordingly, ten feedbacks can be identified, and described as follows:
  1. Albedo feedback: Accelerated warming in the Arctic speeds up the decline of ice and snow cover, further accelerating albedo change. 
  2. Methane feedback: Methane releases in the Arctic further add to the acceleration of warming in the Arctic, further contributing to weaken Arctic methane stores and increasing the danger that methane releases will trigger runaway global warming. 
  3. Currents feedback: Sea ice loss can cause vertical sea currents to weaken, reducing the cooling effect they had on the seabed. This can thus further cause sediments to warm up that can contain huge amounts of methane in the form of free gas and hydrates. 
  4. Storms feedback: Increased frequency and intensity of storms can cause substantially more vertical mixing of the sea water column, causing more warming of the seabed, thus further contributing to the warming of sediments, as above. 
  5. Storms feedback: Accelerated warming in the Arctic can result in more storms, causing mixing of cold Arctic air with warmer air from outside the Arctic. The net result is a warmer Arctic. 
  6. Storms feedback: More open waters can result in more storms that can push the ice across the Arctic Ocean, and possibly all the way out of the Arctic Ocean. 
  7. Storms feedback: Storms also cause more waves that break up the sea ice. Smaller pieces of ice melt quicker than large pieces. A large flat and solid layer of ice is also less susceptible to wind than many lighter and smaller pieces of ice that will stand out above the water and capture the wind like the sails of yachts. 
  8. Storms feedback: Storms cause waters to become more wavy. Calm waters can reflect much sunlight back into space, acting as a mirror, especially when the sun shines under a low angle. Wavy waters, on the other hand, absorb more sunlight. 
  9. Fires feedback: More extreme weather comes with heatwaves and storms. Thus, this is in part another storms feedback. The combination of storms and fires can be deadly. Heatwaves can spark fires that, when fueled up by storms, turn into firestorms affecting huge areas and causing huge amounts of emissions. Storms can whip up particles that when deposited on ice, snow or the bare soil, can cause more sunlight to be absorbed. 
  10. Open doors feedback: Accelerated warming in the Arctic causes the polar vortex and jet stream to weaken, causing more extreme weather and making it easier for warm air to enter the Arctic.

These ten feedback are depicted in the diagram below. 


Opening further Doorways to Doom


Until now, the Arctic has been protected from overheating in a number of ways.


Negative Arctic Oscillation conditions are associated with
higher pressure in the Arctic and a weakened polar vortex
(yellow arrows). A weakened jet stream (black arrows) is  
characterized by larger-amplitude meanders in its trajectory
and a reduction in the wave speed of those meanders.
Snow and ice that grows in winter will act as a buffer when temperatures rise in summer. A bright snow and ice cover will reflect most sunlight back into space. Furthermore, a lot of the sunlight that isn't reflected will be consumed by the process of turning snow and ice into water, which occurs while temperatures remain at the melting point of 0°C (32°F, 273.15 K).

The Arctic is further protected from overheating by the polar vortex and jet stream, which act to keep cold air in the Arctic and keep warm air out. However, accelerated warming in the Arctic is now causing the polar vortex and jet stream to weaken. 


Accelerated warming in the Arctic alters the polar jet stream by slowing its speed and by increasing its waviness. Larger swings in the jet stream allow frigid air from the Arctic to plunge farther south, as well as warm, moist tropical air to penetrate northward, explains Jennifer Francis, research
professor at the Institute of Marine and Coastal
Sciences at Rutgers University.

The polar jet stream can travel at speeds greater than 100 mph. Here, the fastest winds are colored red; 
slower winds are blue. View animated version here. Credit: NASA/Goddard Space Flight Center

What is described above can be regarded as an "open doors feedback". It's like leaving the doors open when it's cold inside and hot outside.

Accelerated warming in the Arctic comes with many such feedbacks, e.g. higher temperatures and more open water in the Arctic can also be expected to increase the danger that storms will batter the sea ice with greater ferocity. This is depicted in the image below.


In many ways, this is opening the doorways to doom. The biggest danger is that temperature rises will cause Arctic methane stores to weaken, resulting in huge amounts of methane to be released, triggering warming that could escalate into runaway global warming.  

The image below shows the sea surface temperature anomaly for August 27, 2012, by the National Oceanic and Atmospheric Administration (NOAA).


Rising temperatures in the Arctic threaten to trigger methane releases, as shown on the poster below.


The poster is also part of the presentation below:


Monday, August 27, 2012

Paul Beckwith on ice speed and drift


Above image shows Arctic sea ice extent (total area of at least 15% ice concentration) for the last 7 years, compared to the average 1972-2011, as calculated by the Polar View team at the University of Bremen, Germany.

View Paul Beckwith's August 27 presentation on sea ice speed and drift by clicking on the following link:
https://docs.google.com/file/d/0ByLujhsHsxP7OXliVnN4T3lnekE/edit


Or, view the presentation in the window below (it may take some time for the file to fully load).


NSIDC: Arctic sea ice breaks lowest extent on record

The National Snow and Ice Data Center (NSIDC) reports that Arctic sea ice has broken the previously lowest extent on record, which was in 2007.

Arctic sea ice extent fell to 4.10 million square kilometers (1.58 million square miles) on August 26, 2012. This was 70,000 square kilometers (27,000 square miles) below the September 18, 2007 daily extent of 4.17 million square kilometers (1.61 million square miles).

NSIDC scientist Walt Meier said, "By itself it's just a number, and occasionally records are going to get set. But in the context of what's happened in the last several years and throughout the satellite record, it's an indication that the Arctic sea ice cover is fundamentally changing."

According to NSIDC Director Mark Serreze, "The previous record, set in 2007, occurred because of near perfect summer weather for melting ice. Apart from one big storm in early August, weather patterns this year were unremarkable. The ice is so thin and weak now, it doesn't matter how the winds blow."

"The Arctic used to be dominated by multiyear ice, or ice that stayed around for several years," Meier said. "Now it's becoming more of a seasonal ice cover and large areas are now prone to melting out in summer."

With two to three weeks left in the melt season, NSIDC scientists anticipate that the minimum ice extent could fall even lower.

References
NSIDC: Arctic sea ice breaks lowest extent
NSIDC Media Advisory: Arctic sea ice breaks lowest extent on record
NSIDC: Arctic Sea Ice News and Analysis


Saturday, August 25, 2012

Future of Arctic Ice: The Three Perspectives

By Veli Albert Kallio
Veli Albert Kallio in front of Peter Wadhams and John Nissen at
APPCCG event, March 13, 2012, House of Commons, London


I use three type sources to assess climate:
  1. the peer-reviewed literature and news reports; 
  2. the whistle-blower organisations (Wikileaks, Cialeaks that release data files from the US Army, Navy, Air Force, CIA, the US State Department, or intercepted corporate telephone or Internet communications; and 
  3. indigenous people’s organisations and their ethnoclimatology people.

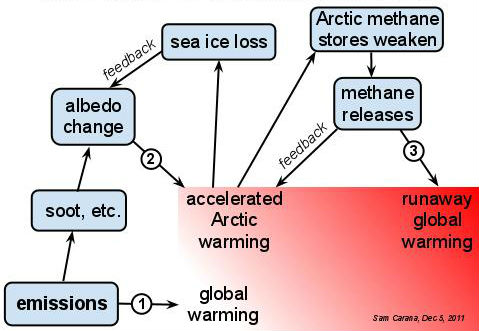
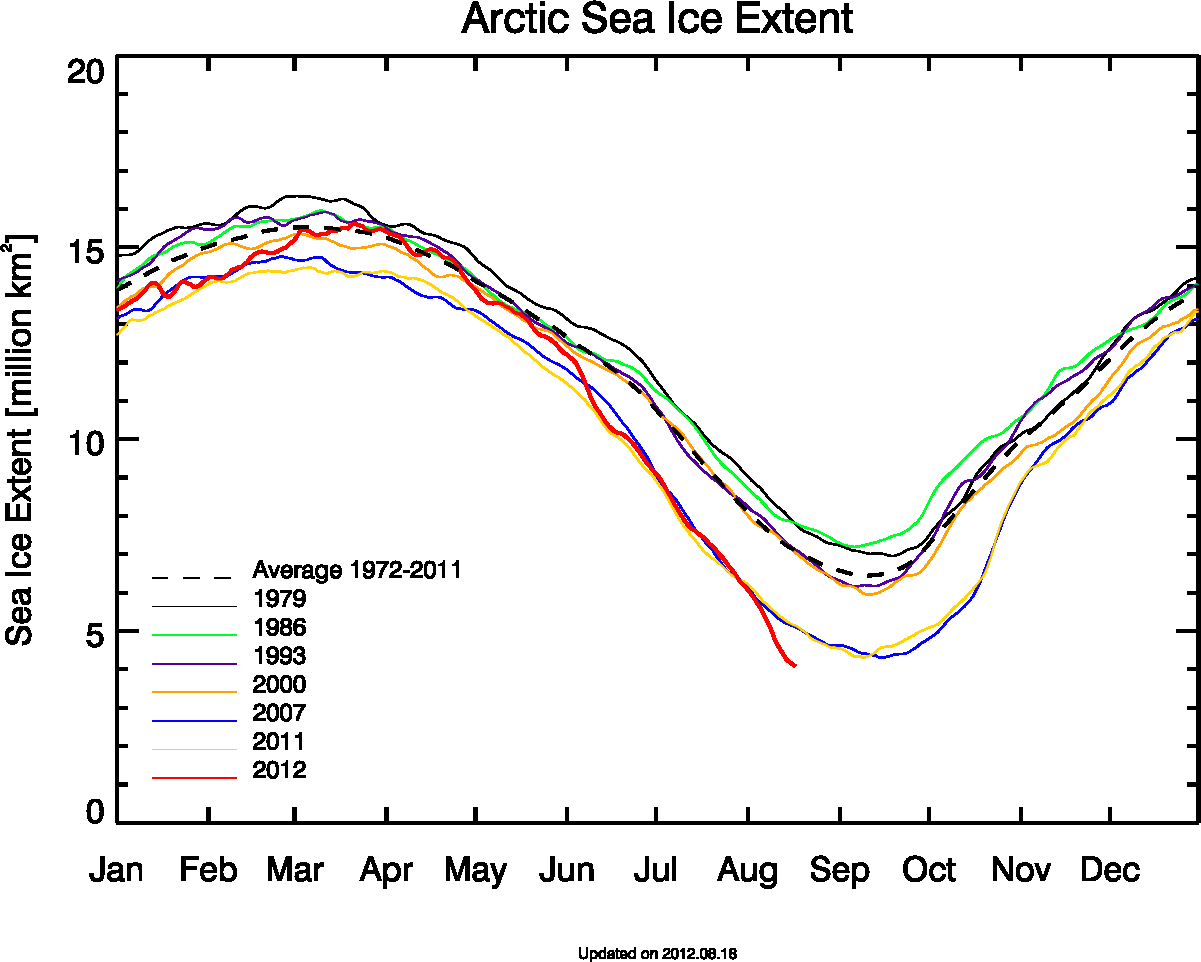
June 26, 2012: the Cialeaks released data files from the US stating that the North Pole will be ice free in 2013. These appear to be submarine upward sonar readings of ice from the US Navy. These contrast strongly what NSIDC is saying about the sea ice surviving much longer. I do not know the reason why US Navy and NSIDC advice differently on this point (an exponential trend projection based on PIOMAS data gives zero-ice 2015).

As per the question, where all heat goes after the sea ice has melted, I stick to the advice given in the United Nations General Assembly motion 101292: the Polar Ice responds extremely fast: first the sea ice melts and disintegrates, then followed by intense methane surges and equally rapid losses of the Arctic terrestrial ice cover in Greenland which never melts, but collapses instead.

After the sea ice loss, the permafrost and Greenland Ice Sheet take up a large portion of that energy that was previously used to melt the sea ice during the short summers. As a result, the ocean warms up and rains much more water than now with the flash-floods becoming very frequent in Greenland. As a result many times more water appears on top of Greenland’s Ice Sheet.

Greenland Ice Sheet rapidly metamorphoses from a (cold, dry, stable) moraine-forming ice sheet into a (warm, wet, dynamic) aggregate-forming ice sheet as the water amount within ice sheet and at its base increase. The bottom part of the ice sheet turns increasingly into water-logged, “mushy” ice that loses its internal strength, while pot holes on bedrocks become filled by water.

By 2020's 1/3 of Greenland Ice Sheet's base (between ice and bedrock) is dotted with water ponds at which point the rapid erosion processes (cavitation, plucking and kolking) pulverise the ice so aggressively that an "ice sheet thrust" develops against coastal perimeter at Melville Bay area. Even the dry parts of ice sheet then no longer can hold the ice dome in place and Heindrich Ice Berg Calving Event (H-1) occurs.

After the Heindrich Minus One (H-1) event the North Atlantic Ocean between America and Europe fills by broken ice that triggers a near-instantaneous severe climate cooling: the Last Dryas. Europe will see many years lasting freeze with Dryas Octopetala rapidly taking hold across continent's then barren soils. The ice volume is 10 times less in Greenland than in a similar event when the Hudson Bay Ice Dome reminders collapsed.

This ice evolution history of the First Nations of Americas as expressed on the UN General Assembly motion 101292 and the Plantagon Declarations, were used on the global-warming themed film “A Day After Tomorrow” and also “2012” by director Roland Emmerlich. Unfortunately, the films assigned incorrect physics and caused great annoyance among the Native American Indian communities due to many other inaccuracies in details therein:

“2012” films ‘mystery radiation of sun’ was never caused by neutrinos, but methane: the Bøllinger Years. The ‘core melting’ was due to the displacement of asthenosphere’s fluids as the heavy Foxe-Laurentide Ice Dome destabilised forcing the liquid minerals in asthenosphere to move out of way, the pressures causing huge eruptions and lava floods (asthenosphere is like a “wet sponge”, a composite of solid and liquid minerals).

“A Day After Tomorrow’s freeze failed the Boyle’s Law: ultra-cold stratosphere cannot fall, and cause instantaneous sea level jump that was followed by the Younger Dryas freeze-up, but ice can.

The First Nations of Americas have raised the alarm very clearly continuously for the last 20 years since the first Rio de Janeiro summit in 1992 that the West is living in delusions (including its scientists). Just like the perimeter between the south tip of the Baffin Island and the north tip of Newfoundland once failed, ending the Ice Ages, the rapid melt water accumulation same way destroys now Greenland’s perimeter barrier at Melville Bay. Wet solidus damage causing lava floods and inlet fjord leaks can suddenly speed it up even more unpredictably.

Here is Professor Oren Lyon Jr.’s (Native American Tradition-Keeper and Historian of the Six Nations who worked at the University of Buffalo), the Internet summary of the Plantagon Declarations: http://www.youtube.com/watch?v=4OjjPETcz6A

There is no point just to observe and repeat only points that appear in the professional literature. I want other communities’ perspectives and wisdom to be also realised and acknowledged:

+ either: the ancient experiences of the ancient people,

+ or: for the huge risks that people take to uncover often illegal practises by the corporations who are often acting in tacit co-operation with government officials, scientists or industrialists who are hostile to admit publically the role of greenhouse gases that violate their pet paradigm that the economic growth can be based on infinite growth from fossil-fuelled supply of goods and services.

Veli Albert Kallio, FRGS
International Guru Nanak Peace Prize Nominee for 2008;
sea level rise risk for global security & economic stability.

India gears up to order 22 Apache helicopters for $1.4 bn


 NEW DELHI: India is getting ready to order 22 heavy-duty Apache helicopters for around $1.4 billion, in what will be yet another big defence deal to be bagged by the US.

The US has already made military sales worth over $8 billion to India over the last few years, despite it having lost out to France in the almost $20 billion MMRCA (medium multi-role combat aircraft) project to supply 126 fighters to IAF, which is in the final commercial negotiations stage.

 In the battle for the attack helicopters, Boeing's AH-64 D Apache Longbow met all air staff qualitative requirements during the field trials conducted by the IAF, while the Russian Mil Moscow Helicopter Plant's Mi-28 Havoc failed to pass muster.

"It's just a matter of time before the contract is inked for the Apaches after final commercial negotiations. Most of the hurdles have been cleared,'' a defence ministry official said. The US and Russia are also locked in battle to supply 15 heavy-lift helicopters to IAF, with the Boeing-manufactured Chinooks pitted against the Russian Mi-26 choppers.

Indian armed forces are looking to induct as many as 900 helicopters in the coming decade, including 384 light-utility and observation, 90 naval multirole, 65 light combat, 22 heavy-duty attack, 139 medium-lift and 15 heavy-lift, among others, many of them from abroad.

The impending $1.4 billion deal for the 22 Apaches will also include the supply of 812 AGM-114 L-3 Hellfire Longbow missiles, 542 AGM-114 R-3 Hellfire-II missiles, 245 Stinger Block I-92 H missiles and 12 AN/APG-78 fire-control radars.

Among the other military aviation deals already bagged by the US are the $4.1 bn contract for 10 C-17 Globemaster-III strategic airlift aircraft, $2.1 billion for eight P-8 I maritime patrol aircraft and $962 million for six C-130 J 'Super Hercules'' planes.


How much sea ice is lost daily?

How much sea ice is lost in the Arctic daily? What are your estimates (in square km and cubic km)? 


Paul Beckwith
Paul Beckwith, B.Eng, M.Sc. (Physics),
Ph. D. student (Climatology) and
Part-time Professor, University of Ottawa

Losses of 100,000 square kilometer per day loss of sea ice area are being reported by various sources. Images of ice speed and drift, in conjunction with ice thickness, would support this.

This rate of loss is as large as that lost during the August 3rd to 10th cyclone (700,000 to 800,000 square kilometers lost for the duration of the cyclone).

My prediction that we'll lose virtually all sea ice by September 30th, 2012, still seems very reasonable.


Sam Carana

I too estimate there have been losses of 100,000 square kilometer per day for over two months now.

The top image at my recent post on ice extent shows that extent has roughly halved in two months time, from over 12 million square km at the start of June to roughly 6 million square km at the start of August. That's a loss of about 6 million square km in two months time, or about 100,000 square km per day.

To date, this loss rate appears to have continued in August and shows no signs of decreasing yet.

Cyclone Warning

By Harold Hensel, edited by Sam Carana

The Google Earth view below shows an Arctic Cyclone going over Alaska and entering the Arctic Ocean.

Arctic - Google Earth view
The warm rain and wind will further deteriorate the North Pole Ice Cap.

In case you're looking for news in Tropical Storm ISAAC, see the images below.

Tropical Storm ISAAC - Google Earth view
Tropical Storm ISAAC - NOAA image
Above image and the image below are from the NOAA National Hurricane Center. For updates on ISAAC, check that site!
Tropical Storm ISAAC - NOAA image


Friday, August 24, 2012

Arctic sea ice extent update

The image below shows sea ice extent as calculated by the Polar View team at the University of Bremen, Germany, updated August 25, 2012.


The image below, edited from the National Snow & Ice Data Center (NSIDC), shows the situation according to the NSIDC updated at August 23, 2012. It's clear that Arctic sea ice extent looks set to reach the 2007 record low within days, if it hasn't been reached already now.


For updates, see the daily images produced by the NSIDC. Note that, to calculate extent, both the NSIDC and the Univeristy of Bremen include areas that show at least 15% sea ice. In the image below, from the Danish Meteorological Institute (DMI), areas with ice concentration higher than 30% are included to calculate ice extent.


Wednesday, August 22, 2012

Indian Coast Guard get new Hovercrafts


Indian Coast Guard Hovercraft H-187, the first of the series of 12 Air Cushion Vehicles (ACVs) designed and built by Griffon Hoverwork Limited

The 21 meters long Air Cushion Vehicle displaces 31 tonnes and can achieve a maximum speed of 45 knots. The ACV is capable of undertaking multi-farious tasks such as surveillance, interdiction, search and rescue and rendering assistance to small boats/craft in distress at sea.

Monday, August 20, 2012

Record low sea ice area


Arctic sea ice area reached a record low of 2.87746 million square km on the 230th day of 2012, as illustrated on the image below by The Cryosphere Today.


Below the sea surface temperature anomaly for August 20, 2012, by the National Oceanic and Atmospheric Administration (NOAA).


Rising temperatures in the Arctic threaten to trigger methane releases, as shown on the poster below.


The poster forms part of the updated presentation Why act now, and how?

Sunday, August 19, 2012

Tipping Points

The increasing melt may be a harbinger of greater changes such as the release of methane compounds from frozen soils that could exacerbate warming, and a thaw of the Greenland ice sheet, which would contribute to rising sea levels, NASA’s top climate scientist, James Hansen, said in an e-mail interview, reports Bloomberg.

“Our greatest concern is that loss of Arctic sea ice creates a grave threat of passing two other tipping points -- the potential instability of the Greenland ice sheet and methane hydrates,” Hansen said. “These latter two tipping points would have consequences that are practically irreversible on time scales of relevance to humanity.”


Above image shows methane levels over a period of four years, from August 1, 2008, to August 1, 2012.


Above image shows methane levels over one years, from August 1, 2011, to August 1, 2012. This shows a marked increase in methane levels on the last of the four years further above.


Above image shows methane levels from August 1, 2012, to August 15, 2012. The image shows high levels of methane across the northern hemisphere. Note the high levels above Greenland.

Saturday, August 18, 2012

Serving Aircraft carriers of the world


The French navy has one nuclear-powered aircraft carrier, which is named after the country's late president, Charles de Gaulle
U.S. aircratf carrier Carl Vinson
U.S. aircraft carrier Harry S. Truman
U.S. aircraft carrier Dwight D. Eisenhower
U.S. aircraft carrier Abraham Lincoln
India's only aircraft carrier, the INS Viraat, is a warship that was purchased from the United Kingdom. It was formerly known as the HMS Hermes before being refitted by India
The 17,000-metric ton Principe de Asturias is the aircraft carriers used by the Spanish Navy
The 14,000-metric ton aircraft carrier Giuseppe Garibaldi of Italy
Receiving most of its military heritage from the former Soviet Union, Russia now operates the Admiral Kuznetsov, with a displacement of more than 67,000 metric tons


Friday, August 17, 2012

Arctic sea ice updates


Above diagram shows sea ice extent as calculated by the Polar View team at the University of Bremen, Germany.

Paul Beckwith warns that a second cyclone is threatening to batter the remaining sea ice soon.

View Paul's presentation by clicking on the link below.
https://docs.google.com/file/d/0ByLujhsHsxP7cnB0bXhNNFFSQjQ/edit


Or, view the presentation in the window below (it may take some time for the file to fully load).


and below, Paul's August 17 update:

Indian Army gets battle-ready on Jaisalmer border with Pakistan with model modern military station

Move seen part of the cold start doctrine in which Indian armored column will move in to occupy Pakistan in case Pakistan government abdicates or collapses to Taliban militants

South Punjab - Multan, Quetta in Balochistan and Karachi will be the main thrust using the Indus valley for transportation


Jaisalmer is set to house the first “model modern military station” of the country with reduced response time to emergencies, battle-ready capabilities in modern warfare and a set up critical to the supply chain for army rationing.

According to highly placed sources, the Indian Army has decided to develop a modern army base in the border district to cut down on the response time to an emergency, including a reduction in travel time in case of a disturbance along the border. It’s proximity to the international border of India and Pakistan, has got the army to reap the benefits of this strategic location for securing the nation against any foreign aggression in future. At present, the army base at Jodhpur is trained to respond to a situation across the border, but to expedite heavy military movement, a station close to the border is being put up, sources said. The distance from Jodhpur to the border is around 300 km. Having a base at Jaisalmer would save at least 6-7 hours for the troops. “In case of disturbance or war-like situation, when every minute counts, such a response time can turn the situation around,” a reliably placed official said, adding, “Because of its location Jaisalmer is being developed as a defence hub; the defence department has identified some places where the latest technology would be installed as a tactical ploy in modern warfare; Jaisalmer is one of them.”


However, the officer refused to divulge details about the facility that is being installed in Jaisalmer.
A senior administrative official in Jaisalmer said, “Several units have already moved from Jodhpur to Jaisalmer. And the scale of the activities clearly indicates that Indian Army has big plans for Jaisalmer.” The officer also said that the availability of land for setting up an enterprise of such scale facilitated the development of the station in Jaisalmer. “In other border districts availability of land was an issue,” the officer said.