Saturday, May 31, 2014

How many deaths could result from failure to act on climate change?

A recent OECD study concludes that outdoor air pollution is killing more than 3.5 million people a year globally. The OECD estimates that people in its 34 Member countries would be willing to pay USD 1.7 trillion to avoid deaths caused by air pollution. Road transport is likely responsible for about half.

A 2012 report by DARA calculated that 5 million people were dying each year from climate change and carbon economies, mostly from indoor smoke and (outdoor) air pollution.

Back in 2012, a Reuters report calculated that this could add up to a total number of 100 million deaths over the coming two decades. This suggests, however, that failure to act on climate change will not cause even more deaths due to other causes.

Indeed, failure to act on climate change could result in many more deaths due to other causes, in particular food shortages. As temperatures rise, ever more extreme weather events can be expected, such as flooding, heatwaves, wildfires, droughts, and subsequent crop loss, famine, disease, heat-stroke, etc.

So, while currently most deaths are caused by indoor smoke and outdoor air pollution, in case of a failure to act on climate change the number of deaths can be expected to rise most rapidly among people hit by famine, fresh water shortages, as well as wars over food, water, etc.

How high could figures rise? Below is an update of an image from the earlier post Arctic Methane Impact with a scale in both Celsius and Fahrenheit added on the right, illustrating the danger that temperature will rise to intolerable levels if little or no action is taken on climate change. The inset shows projected global number of annual climate-related deaths for these two scenarios, i.e. no action and little action, and also shows a third scenario of comprehensive and effective action that would instead bring temperature rise under control.

[ click on image to enlarge ]
For further details on a comprehensive and effective climate plan, see the ClimatePlan blog.


Sunday, May 25, 2014

Large Falls in Arctic Sea Ice Thickness over May 2014

Comparing ice thickness (in meters) on May 2, 2014 (left) and May 30, 2014 (right, forecast run May 25, 2014)
Arctic sea ice has shown large falls in thickness in many areas over the course of May 2014, as shown on above image. The animation below also compares the situation between May 2, 2014, and May 30, 2014 (as forecast by Naval Research Laboratory on May 23, 2014). Ice thickness is in meters.


Thickness is an important indicator of the vulnerability of the ice. If only looking at sea ice extent, one might (wrongly) conclude that sea ice retreat was only minor and that everything looked fine. By contrast, when looking at thickness, it becomes evident that large falls have occurred over the course of May 2014.

Falls at the edges of the sea ice can be expected at this time of the year, but the large fall closer to the center is frightening. On the one hand, it appears to reflect cyclonic weather and subsequent drift of the ice. On the other hand, it also indicates how vulnerable the sea ice has become. Last year, a large area showed up at the center of the sea ice where the ice became very thin, as discussed in July 2013 in the post Open Water at North Pole and again in the September 2013 post North Hole.

The appearance of huge weak areas at the center of the sea ice adds to its vulnerability and increases the prospect of total sea ice collapse, in case of one or more large cyclones hitting the Arctic Ocean later this year. To highlight the dangerous situation, the main image from a post earlier this month is again added below.


Adding to the concerns are huge sea surface temperature anomalies, as illustrated by the image below, showing anomalies at May 23, 2014, and created by Harold Hensel with ClimateReanalyzer and Google Earth.

[ click on image to enlarge ]
The image below shows sea surface anomalies on May 26, 2014, with an overlay of land temperatures, as created by Harold Hensel and edited by Sam Carana.


The image shows sea surface temperatures on the Northern Hemisphere that are 1.44 degrees Celsius warmer than the baselline temperature, despite large areas with cold water partly resulting from the huge amounts of meltwater flowing down along the edges of Greenland into the North Atlantic Ocean. The graph below shows Northern Hemisphere and Global sea surface temperature anomalies over May 2014.

By comparison, current (May 27, 2014) surface temperature anomalies of 0.64°C globally and 0.84°C for the NH. The image below shows annual temperature anomalies (land and ocean data).


Meanwhile, the development of this year's 'north hole' at the center of the sea ice appears to persist, as illustrated by the image below.


Thursday, May 22, 2014

The real budgetary emergency and the myth of "burnable carbon"

by David Spratt


How fast and how profoundly we act to stop climate change caused by human actions, and work to return to a safe climate, is perhaps the greatest challenge our species has ever faced, but are we facing up to what really needs to be done?

We have to come to terms with two key facts: practically speaking, there is no longer a "carbon budget" for burning fossil fuels while still achieving a two-degree Celsius (2°C) future; and the 2°C cap is now known to be dangerously too high.

No Carbon Budget Left - David Spratt from Breakthrough  -  "We have no carbon budget left
for burning of fossils fuels - emergency action is now the only viable path"  - 
David Spratt

For the last two decades, climate policy-making has focused on 2°C of global warming impacts as being manageable, and a target achievable by binding international treaties and incremental, non-disruptive, adjustments to economic incentives and regulations (1).

But former UK government advisor Professor Sir Robert Watson says the idea of a 2°C target "is largely out of the window”, International Energy Agency chief economist Fatih Birol calls it "a nice Utopia", and international negotiations chief Christiana Figueres says we need "a miracle". This is because, in their opinions, emissions will not be reduced sufficiently to keep to the necessary "carbon budget" (2).

The carbon budget has come to public prominence in recent years, including in the Intergovernmental Panel on Climate Change (IPCC) Fifth Assessment Report in 2013, as being the difference between the total allowable greenhouse gas emissions for 2°C of warming, and the amount already emitted or spent. The budget varies according to the likelihood of overshooting the target: the higher the risk, the bigger the budget. In the IPCC report, no carbon budget is given for less than a one-in-three chance of failure.

At that one-in-three risk of failure, the IPCC says the total budget is 790 GtC (gigatons, or one billion tons, of carbon), less emissions to 2011 of 515 GtC, leaving a budget of 275 GtC in 2011, or ~245 GtC in 2014 (3).

What is less well understood is that if the risk is low, there is no carbon budget left (4).

Breakthrough National  Climate Restoration
Forum 21-22 June,  Melbourne
Climate change with its non-linear events, tipping points and irreversible events – such as mass extinctions, destruction of ecosystems, the loss of large ice sheets and the triggering of large-scale releases of greenhouse gases from carbon stores such as permafrost and methane clathrates – contains many possibilities for catastrophic failure.

Ian Dunlop, a former senior risk manager and oil and coal industry executive, says the management of catastrophic risk has to be very different from current processes. As serious, irreversible outcomes are likely, this demands very low probabilities of failure: management of catastrophic risk "must centre around contingency planning for high-impact and what were regarded as low-probability events, which unfortunately are now becoming more probable… Major, high-risk industrial operations, such as offshore oil exploration, provide a model, with detailed contingency planning and sequential barriers being put in place to prevent worst-case outcomes" (5).

If a risk-averse (pro-safety) approach is applied – say, of less than 10% probability of exceeding the 2°C target – to carbon budgeting, there is simply no budget available, because it has already been used up. A study from The Centre for Australian Weather and Climate Research shows that "the combination of a 2°C warming target with high probability of success is now unreachable" using the current suite of policy measures, because the budget has expired (6).

This is illustrated in Figure 1 where, as we move to the right (greater probability of meeting target) along the blue line which is the 2°C carbon budget, we reach a point around 90% probability (blue circle) where the total budget intersects with what we have already emitted.


As well, on-going greenhouse emissions associated with food production and deforestation are often conveniently pushed to one side in discussing carbon budgets. UK scientists have shown that if some reasonably optimistic assumptions are made about deforestation and food-related emissions for the rest of the century, then most emission reduction scenarios are incompatible with holding warming to +2ÂșC, even with a high 50% probability of exceeding the target. In other words, food and deforestation has taken up the remaining budget, leaving no space for fossil fuel emissions (7).

In addition, the carbon budget analysis makes optimistic and risky assumptions about the stability of Arctic, and of polar and other carbon stores such as permafrost. As one example, the modelling discussed in the IPCC report projects an area of summer Arctic sea-ice cover in the year 2100 higher that actually exists at the moment, yet there is a great deal more warming and sea-ice loss to come this century! In fact, many Arctic specialists think the Arctic will be sea-ice free in summer within the next decade, with consequences for global warming that the carbon budget calculations have significantly underestimated. (8)

Australian Climate Council member Prof. Will Steffen says the IPCC carbon budget may "be rather generous". The IPCC report says the modelling used does not include explicit representation of permafrost soil carbon decomposition in response to future warming, and does not consider slow feedbacks associated associated with vegetation changes and ice sheets. Recent research suggests these events could happen well below 2°C of warming, so they should be taken into account, but they are not.

Accounting for the possible release of methane from melting permafrost and ocean sediment implies a substantially lower budget (9). This reinforces the need to take a pro-safety, risk-averse approach to the carbon budget, especially since some research suggests that Arctic permafrost may be vulnerable at less than 2°C or warming (10).

For all these reasons – that is, prudent catastrophic risk management, accounting for food production and deforestation emissions, and for Arctic sea ice and carbon store instability – the idea of "burnable carbon" – that is, how much more coal, gas and oil we can burn and still keep under 2°C – is a dangerous illusion, based on unrealistic, high-risk, assumptions.

A second consideration is that 2°C of warming is not a safe target. Instead, it's the boundary between dangerous and very dangerous (11), and 1°C higher than experienced during the whole period of human civilisation (12), illustrated in Figure 2. The last time greenhouse gas levels were as high as they are today, modern humans did not exist (13), so we are conducting an experiment for which we have no direct observable evidence from our own history, and for which we do not know the full result.


However, we do understand that many major ecosystems will be lost, a 2°C sea-level rise will eventually be measured in the tens of metres (14), and much of human civilisation and large, productive river delta systems will be swamped. There is now evidence to suggest that the current conditions affecting the West Antarctic ice sheet are sufficient to drive between 1.2 and 4 metres of sea rise (15), and evidence that Greenland will contribute more quickly (16), and they are just two contributors to rising sea levels.

It is now clear that the incremental-adjustment 2°C strategy has run out of time, if for no other reason than the "budget" for burning more fossil fuels is now zero, yet the global economy is still deeply committed to their continuing widespread use.


We all wish the incremental-adjustment 2°C strategy had worked, but it hasn't. It has now expired as a practical plan.

We now have a choice to make: accept much higher levels of warming of 3–5°C that will destroy most species, most people and most of the world's ecosystems; a set of impacts some more forthright scientists say are incompatible with the maintenance of human civilisation.

Or we can conceive of a safe-climate emergency-action approach which would aim to reduce global warming back to the range of conditions experienced during the last 10,000 years, the period of human civilisation and fixed settlement. This would involve fast and large emissions reduction through radical energy demand reductions, whilst a vast scaling-up of clean energy production was organised, together with the remaking of many of our essential systems such as transport and food production, with the target being zero net emissions. In addition, there would need to be a major commitment to atmospheric carbon dioxide drawdown measures. This would need to be done at a speed and scale more akin to the "war economy", where social and economic priority is given to what is perceived to be an overwhelming existential threat.

After 30 years of climate policy and action failure, we are in deep trouble and now have to throw everything we can muster at the climate challenge. This will be demanding and disruptive, because there are no longer any non-radical, incremental paths available.

Prof. Kevin Anderson and Dr Alice Bows, writing in the journal Nature, say that "any contextual interpretation of the science demonstrates that the threshold of 2°C is no longer viable, at least within orthodox political and economic constraints" and that "catastrophic and ongoing failure of market economics and the laissez-faire rhetoric accompanying it (unfettered choice, deregulation and so on) could provide an opportunity to think differently about climate change" (17).

Anderson says there is no longer a non-radical option, and for developed economies to play an equitable role in holding warming to 2°C (with 66% probability), emissions compared to 1990 levels would require at least a 40% reduction by 2018, 70% reduction by 2024, and 90% by 2030. This would require "in effect a Marshall plan for energy supply". As well low-carbon supply technologies cannot deliver the necessary rate of emission reductions and they need to be complemented with rapid, deep and early reductions in energy consumption, what he calls a radical emission reduction strategy (18). All this suggests that even holding warming to a too-high 2°C limit now requires an emergency approach.

Emergency action has proven fair and necessary for great social and economic challenges we have faced before. Call it the great disruption, the war economy, emergency mode, or what you like; the story is still the same, and it is now the only remaining viable path.


keynote speaker, David Spratt, explains why there is no carbon budget left to burn.

Sources:
This article was originally published at ClimateCodeRed.org
Above video, NO CARBON BUDGET LEFT TO BURN, was uploaded by Breakthrough.


Notes
  1. Jaeger, C.C. and J. Jaeger (2011), "Three views of two degrees", Reg. Environ. Change, 11: S15-S26; Anderson, K. and A. Bows (2012) “A new paradigm for climate change”, Nature Climate Change 2: 639-70
  2. http://www.bbc.co.uk/news/science-environment-19348194; http://www.guardian.co.uk/environment/2011/may/29/carbon-emissions-nuclearpow; http://www.smh.com.au/environment/weather/climate-pioneers-see-little-chance-of-avoiding-dangerous-global-warming-20131105-2wyon.html
  3. IPCC (2013) "Working Group I Contribution to the IPCC Fifth Assessment Report Climate Change 2013; The Physical Science Basis: Summary for Policymakers"
  4. "For a 90% probability of not exceeding 2C of warming the carbon budget had reduced to zero by 2012, using a multi-agent (that is, the well-mixed greenhouse gases, including CO2 and CH4)", Raupach (2013, unpublished), based on Raupach, M. R., I.N. Harman and J.G. Canadell (2011) "Global climate goals for temperature, concentrations, emissions and cumulative emissions", Report for the Department of Climate Change and Energy Efficiency. CAWCR Technical Report no. 42. Centre for Australian Weather and Climate Research, Melbourne; Rogelj, J., W. Hare et al. (2011) "Emission pathways consistent with a 2°C global temperature limit", Nature Climate Change 1: 413-418 show at Table 1 no feasible pathways for limiting warming to 2°C during the twenty-first century with a "very likely" (>90%) chance of staying below the target, without carbon drawdown.
  5. Dunlop, I. (2011), "Managing catastrophic risk", Centre for Policy Development, 
  6. http://cpd.org.au/2011/07/ian-dunlop-managing-catastrophic-risk/
  7. Raupach, M. R., I.N. Harman and J.G. Canadell (2011) "Global climate goals for temperature, concentrations, emissions and cumulative emissions", Report for the Department of Climate Change and Energy Efficiency. CAWCR Technical Report no. 42. Centre for Australian Weather and Climate Research, Melbourne. 
  8. Anderson, K. and A. Bows (2008) “Reframing the climate change challenge in light of post-2000 emission trends”, Phil. Trans. R. Soc. A 366: 3863-3882; Anderson, K. and A. Bows (2011) “Beyond ‘dangerous’ climate change: emission scenarios for a new world”, Phil. Trans. R. Soc. A 369: 20–44
  9. Wadhams, P. (2012) “Arctic ice cover, ice thickness and tipping points”, AMBIO 41: 23–33; Maslowski, W., C.J. Kinney et al. (2012) "The Future of Arctic Sea Ice", The Annual Review of Earth and Planetary Sciences, 40: 625-654
  10. IPCC (2013) "Working Group I Contribution to the IPCC Fifth Assessment Report Climate Change 2013; The Physical Science Basis;
  11. Vaks, A., O.S. Gutareva et al. (2013) “Speleothems Reveal 500,000-Year History of Siberian Permafrost”, Science 340: 183-186; Schaefer, K., T. Zhang et al. (2011) "Amount and timing of permafrost carbon release in response to climate warming", Tellus 63:165-180
  12. Anderson, K. and A. Bows (2011) “Beyond ‘dangerous’ climate change: emission scenarios for a new world”, Phil. Trans. R. Soc. A 369: 20–44
  13. Marcott, S.A, J.D. Shakun et al. (2013) "A Reconstruction of Regional and Global Temperature for the Past 11,300 Years", Science 339: 1198-120; Hansen, J., P. Kharecha et al. (2013) "Assessing 'dangerous climate change': Required reduction of carbon emissions to protect young people, future generations and nature", Plos One 8: 1-26
  14. Tripadi, A.K., C.D. Roberts et al. (2009), "Coupling of CO2 and Ice Sheet Stability Over Major Climate Transitions of the Last 20 Million Years", Science 326: 1394-1397
  15. Rohling, E. J.,K. Grant et al. (2009) “Antarctic temperature and global sea level closely coupled over the past five glacial cycles”, Nature GeoScience, 21 June 2009 `af
  16. NASA (2014), "NASA-UCI Study Indicates Loss of West Antarctic Glaciers Appears Unstoppable", Media release, 12 May 2014, http://www.nasa.gov/press/2014/may/nasa-uci-study-indicates-loss-of-west-antarctic-glaciers-appears-unstoppable, accessed 19 May 2014; Rignot, E., J. Mouginot et al. (2014) "Widespread, rapid grounding line retreat of Pine Island, Thwaites, Smith and Kohler glaciers, West Antarctica from 1992 to 2011", Geophysical Research Letters, doi: 10.1002/2014GL060140; Joughin, I., B.E. Smith et al. (2014), "Marine Ice Sheet Collapse Potentially Under Way for the Thwaites Glacier Basin, West Antarctica", Science 344: 735 -738
  17. NASA (2014), "Hidden Greenland Canyons Mean More Sea Level Rise", Media release, 19 May 2014, http://www.nasa.gov/press/2014/may/hidden-greenland-canyons-mean-more-sea-level-rise, accessed 19 May 2014; Morlighem, M., E. Rignot et al. (2014), "Deeply incised submarine glacial valleys beneath the Greenland ice sheet", Nature Geoscience, doi:10.1038/ngeo2167
  18. Anderson, K. and A. Bows (2012) “A new paradigm for climate change”, Nature Climate Change 2: 639-70
  19. Anderson, K. (2014) "Why carbon prices can’t deliver the 2°C target", 13 August 2013, http://kevinanderson.info/blog/why-carbon-prices-cant-deliver-the-2c-target, accessed 19 May 2014; Anderson, K. (2012) "Climate change going beyond dangerous – Brutal numbers and tenuous hope", Development Dialogue, September 2012; Anderson, K. (2011) "Climate change going beyond dangerous – Brutal numbers and tenuous hope or cognitive dissonance", presentation 5 July 2011, slides available at http://www.slideshare.net/DFID/professor-kevin-anderson-climate-change-going-beyond-dangerous; plus (7) above.

Wednesday, May 21, 2014

The Art of Climate Change

by Dorsi Lynn Diaz

Help be a part of the solution! The Art of Climate Change on Kickstarter - an interactive social media & art show/exhibit this summer.

Climate change is HERE and climate change is happening NOW. It is not a figment of your imagination and the weather outside indeed is "frightening."

As I write this, the UK is getting battered by unprecedented storms and in California where I live, we are facing the possibility of a MEGA drought. As a long-time artist, writer and educator, I have been sounding the alarm bell for years. The question loomed large for me: How are we, as a collective society, going to tackle a huge problem?

That was when I had a light-bulb moment.

The idea came to me last year when I realized we need to have a multi-modal approach to addressing climate change. A hands-on, interactive dialogue with great visuals. In order to tackle the problem we needed to look at all the different aspects of climate change. And thus, the "The Art of Climate Change" was born - and the idea for a project: an art show and exhibit. But not your typical art show!

This show would be interactive and get people thinking about SOLUTIONS to climate change, challenge them to think out of the box, and most importantly, educate them about the how and wheres of climate change plus why places like the Arctic matter. This show could travel to cities and communities all over, and be a blue-print for teaching people about climate change and engage their own local artists, inventors and community in learning about "the problem."


But first I needed a venue to do the first show, and that would be one of the biggest hurdles. I connected with a local gallery, pitched the idea to them and they were impressed. In fact, they really liked my idea because it was "different" because it talked about solutions, not just doom and gloom. So now that I've been approved by their Board of Directors, I've got my venue and the show has taken on a life it its own.

The Art of Climate Change has its venue! Whoooppee!! The show is on the datebook - and it will be in run from June 19 - July 27, 2014 at The Sun Gallery in Hayward, Ca. (located in the Silicon Valley area)

I need help and support however to pull this off. This is a huge endeavor and the show has many different facets to it. I have many costs involved: Marketing, advertising, sign production, printing for the science graphics, some travel, equipment rentals (laptops and TV screens), art supplies, website hosting and building and other production costs... and this is why I am asking for your help. Not only will there be "art" on the walls but there will also be a series of artwork by children on endangered species that I have been teaching for the last several months.

The sections of the exhibit have been broken down into the following areas:

1. A section where we talk about "The Problem". This is where we talk turkey and explain the problem and take a good look at it.

2. There will be a section of the exhibit dedicated to extreme weather photos and art. Like they say, a picture can tell a thousand words, right?

3. Next we need to talk about "The Arctic and why it matters". Those record cold snaps happening in the US? Those are one of the strongest symptoms of our melting Arctic. That's due to our now meandering jet stream.

4. The Methane Monster. Yes there are monsters and this is probably one of the biggest ones we need to be worried about. Remember the dinosaur extinction? Well, scientists say that methane was their undoing. And we certainly don't want to go the way of the dinosaurs, right? So yes, we need to talk about the elephant in the room - that pesky methane monster. Which, by the way, is being released in some pretty scary amounts right now from underneath that warming Arctic water. No, it's not good. Not good at all.

5. A section just for THE CHILDREN and EDUCATION. This is the biggest reason I am doing this project. I want to be part of the solution to securing their future. One of the big parts of this project is teaching the kids. Right now I am doing a series of projects with them on endangered animal species. The way I look at it is if we can "teach the children we can touch the world." Their artwork will be prominently displayed in the art/show exhibit. So far they have done done art of endangered Polar Bear cubs, the Monarch Butterfly, Bees, Barn Owls and the Maui Dolphin.

6. A section with a "CALL TO ACTION"....this is where attendees are encouraged to engage with the problem so they can BE PART of the solution...which btw is the next big part of the art show/exhibit....

7. SOLUTIONS. This is where I have things planned that are definitely out of the box. Like inventions to slow down climate change by friends of mine that happen to be very creative too.

So that is my Kickstarter project in a very big nutshell. The really exciting thing though is how this blooming project has just sort of "vacuumed people" up...all kinds of people...from all around the world! Here are some of them that are going to be part of my project:
  • Climate Change Professor Paul Beckwith from the University of Ottawa, who will do a live Skype Q & A session with us. Attendees can sit down face to face with a leading climate change educator and ask questions about climate change from inside the show.
  • A life size mural of a Polar Bear with an Arctic scene, painted in the show/exhibit hall by muralist Lisa Hamblett-Montagnese.
  • Photographer Rose Gold will make the day even more special for kids by taking photos of them with the Polar bear.
  • A display of children and families climate change (endangered species) artwork from students of the Sun Gallery, A Joyful Noise Learning Center, Green Forest Art Studio, The Community Church of Hayward and Young Rembrandt's of the East Bay
  • A live viewing of Andy Lee Robinsons video on a flat screen TV which will be available for viewing all during the exhibits 5 1/2 weeks. Andy's video shows the decline of the Arctic ice accompanied by a musical composition by Andy called "Ice Dreams"
  • A graphic of "The Arctic Death Spiral" by Andy Lee Robinson, to be displayed in the Arctic section of the show.
  • A full size poster by Sam Carana (who set up the Arctic Methane Emergency Group on FB and edits the Arctic-News blog) on the effects of runaway climate change, designed by Sam and displayed in the Arctic section.
  • Original cartoons by Sam Carana, also an adviser on this project, displayed in the Methane section of the show.
  • Quotes with ideas by Harold Hensel, contributor to the Arctic-news blog and advisor on this project.
  • A full size poster of a tunnel invention as a possible solution to our warming waters by Patrick McNulty. Posted in Solutions.
  • A display of alternative fuel named "Bio-Fuel" with information by inventor Jay Toups. Posted in Solutions.
  • A live aquaponics display by Michael and Natalie Elola of Lucky Garden Hydroponics on how to grow vegetables and fruit indoors without using soil. Posted in Solutions.
  • A full size Polar bear costume mascot to be used for outreach. Designed and sewn by Nancy Martinez
  • A call for art by The Sun Gallery for extreme weather photos, climate change art and recycled and re-purposed art
  • A display of childrens books about climate change. Joe Santiago's books will also be featured. Displayed under Education.
  • The original video for the project will be displayed on a flat-screen video at the show for 5 1/2 weeks. Video editing and production by Mead Rose at Web Design by Mead.
  • Artistically designed Climate change confections by pastry chef Cori Diaz for the Artists reception
  • A local rock/punk band that sings songs about climate change. They will sing at the Artists reception.
  • Educational tables set up by the City of Hayward with information about the cities climate change plan along with other entities like the EPA, Water Conservation Board, EBMUD and Waste Management.
  • Deagon B. Williams, friend and adviser on this project.
  • Advertising help with the project by Trish McDermott of Avatar Tech Pubs.
Endangered Animal Art series taught by Dorsi Diaz


he Arctic "Death" Spiral in The Art of Climate Change
Costs for The Art of Climate Change
The many people people contributing their talents to The Art of Climate Change
The main reason I am doing the show is for them
Sam Carana's contribution to the show - a very telling graphic
The types of climate change disasters we need to talk about

This is what we need to be talking about.
Risks and challenges

I have been working on this project already for over 4 months, successfully pulling people together to either create art for the exhibit, or to contribute educational material. The biggest obstacle for the show was of course the venue but I have the venue for the art show/exhibit set in stone from June 19 - July 27 of this year. A solid foundation has been made, the main thing I need help with now is the financial expenses that the show will cost me - like the rental of equipment to do the live Skyping session with Professor Paul Beckwith, and the special art projects I plan to do within our community. I also have plans to do more community outreach to reach more local public agencies and I plan to have more events centered around the show (how much I can do will be determined by how much funding I get)

How will I deal with any special surprises or costs that I might not have possibly factored in? I will do what I always did in business, I will work with the issue and either adjust or downsize that particular part, - possibly even bartering for services, or ask for donations to help with a particular cost.

What unique challenges might I have after the project is funded? Well I don't foresee any emergencies but if there are any, I have a network of people that will help and advise me through any major problems. The only thing I see is that I may not be able to accommodate all the art that may come in, but that's a good problem to have! Better to have more than not enough - and director Liesa Lietzke and Jacqueline Cooper at The Sun Gallery where the show is will be able to help walk me through any major hiccups if there are any.

Questions?

Have a question? If the info above doesn't help, you can ask questions at Kickstarter to the project creator.

Donate

To donate to this project, go to Kickstarter.

Friday, May 16, 2014

More extreme weather can be expected


The heaviest rains and floods in 120 years have hit Serbia and Bosnia this week, Reuters and Deutsche Welle report.

The animation below shows the Jet Stream's impact on the weather. Cold temperatures have descended from the Arctic to Serbia and Bosnia in Europe and all the way down to the Gulf of Mexico in North America, while Alaska, California, and America's East Coast are hit by warm temperatures. In California, 'unprecedented' wildfires and fierce winds lead to 'firenadoes', reports CNN.


The image below shows that on May 15, 2014, the wind approaching Serbia and Bosnia at 700 hPa reached speeds of up to 120 km per hour (75 mph), as indicated by the green circle on the main image and inset.


The image below, from skeptical science, shows the cyclonic spin that can be expected in a through such as the one that hit Serbia and Bosnia recently.


As the Jet Stream changes, more extreme weather events can be expected. What makes the Jet Stream change? As the Arctic is warming up faster than the rest of the world, the temperature difference between the Arctic and the equator decreases, in turn decreasing the speed at which the Jet Stream circumnavigates the globe. This can cause 'blocking patterns', with extreme weather events hitting an area longer than before.

As the jet stream becomes wavier, cold air can more easily descend from the Arctic down to lower latitudes in a downward through of the Jet Stream, while warm air can more easily reach higher latitudes in an upward ridge of the Jet Stream.

This spells bad news for many areas across the world that can be expected to be hit by more extreme weather events such as heatwaves, wildfires fuelled by stronger winds and more intense drought, storms and floods.

Heatwaves are a huge threat in the Arctic, especially when followed by storms that can cause warm surface water to mix down to the bottom of the sea and warm up sediments under the seafloor that can contain huge amounts of methane in the form of hydrates and free gas. The situation is dire and calls for comprehensive and effective action, as discussed at the Climate Plan blog.


Related

- Extreme weather strikes around the globe - update
http://arctic-news.blogspot.com/2014/02/extreme-weather-strikes-around-the-globe-update.html

- Escalating extreme weather events to hammer humanity (by Paul Beckwith)
http://arctic-news.blogspot.com/2014/04/escalating-extreme-weather-events-to-hammer-humanity.html

- Our New Climate and Weather (by Paul Beckwith)
http://arctic-news.blogspot.com/2014/01/our-new-climate-and-weather.html

- Our New Climate and Weather - part 2 (by Paul Beckwith)
http://arctic-news.blogspot.com/2014/01/our-new-climate-and-weather-part-2.html

- Changes to Polar Vortex affect mile-deep ocean circulation patterns
http://arctic-news.blogspot.com/2012/09/changes-to-polar-vortex-affect-mile-deep-ocean-circulation-patterns.html

- Polar jet stream appears hugely deformed
http://arctic-news.blogspot.com/2012/12/polar-jet-stream-appears-hugely-deformed.html


Friday, May 9, 2014

Outlook for sea ice remains bleak


In April 2014, Arctic sea ice reached its annual maximum volume. It was the second lowest on record, according to calculations by the Pan-Arctic Ice Ocean Modeling and Assimilation System (PIOMAS) at the Polar Science Center. The ice volume in March 2014 also was the second lowest on record, as discussed in an earlier post. The fall in volume over the years is illustrated in the graph below, by Wipneus.
Another way of depicting the continuing fall in sea ice volume is the Arctic Death Spiral below, by Andy Lee Robinson.

The graph below, from the Danish Metereological Institute, shows mean temperatures that have been much higher than they used to be at higher latitudes. Mean 2 m temperatures for the region north of the 80th northern parallel as a function of the day of year are shown (red line), against the 1958 - 2002 mean (green line).


High levels of methane over the Arctic will have contributed to these high temperatures. Furthermore, the Jet Stream is changing as the difference in temperature between the Arctic and the equator decreases, causing more extreme weather events such as heatwaves and storms that could speed up the demise of snow and ice cover in the Arctic.

The graph below, by the Japan Aerospace Exploration Agency, shows that Arctic sea ice extent was 12,469,546 km² on May 8, 2014.

In addition, an El Niño event could cause even more ferocious heatwaves and storms to hit the Arctic. The image below, from IRI at Columbia University, shows that the chance of an El Niño event developing in the course of 2014 is close to 80%.


The outlook for the sea ice remains bleak and the possibility that a total collapse could occur in September calls for comprehensive and effective action, as discussed at the climate plan blog.


Monday, May 5, 2014

U.S. Navy Continues Virginia-Class Sub Investments


As the U.S. Navy continues to tweak its redesigned Block III Virginia-class submarines, the service is pushing ahead with its Block IV Virginia plans, awarding a $17.6 billion contract this month to General Dynamics’ Electric Boat Corp for 10 subs between fiscal 2014 and 2018.“The Block IV award is the largest shipbuilding contract in U.S. Navy history in terms of total dollar value and builds upon the Virginia-class program’s successful Navy and industry relationship,” says Rear Adm. David Johnson, program executive officer for submarines.

Under the deal, Electric Boat will still subcontract part of the work to its submarine-building partner Newport News Shipbuilding, a unit of Huntington Ingalls Industries. The fixed-price incentive, multi-year contract calls for about 24% of the work to be done at Newport News.
The Navy confirmed April 16 that it is postponing the commissioning of the Block III Virginia-class attack submarine SSN-784 North Dakota to an undetermined future date because of “the need for additional design and certification work required on the submarine’s redesigned bow and material issues with vendor-assembled and delivered components.” The North Dakota was christened in November and was scheduled to be commissioned on May 31.

The Virginia-class submarines – considered by most inside and outside the Pentagon to be a model acquisition and shipbuilding program – rank as the third-costliest Pentagon program, with a total acquisition cost of about $84.4 billion, the U.S. Government Accountability Office reported recently.The proposed fiscal 2015 Navy budget includes about $5.9 billion for two more Virginia-class subs and continues to procure two Virginia-class SSNs per year through the five-year-defense plan, resulting in an inventory of 21 Virginia-class subs – of 48 total subs – by 2020.


http://aviationweek.com/defense/us-navy-continues-virginia-class-sub-investments

Sunday, May 4, 2014

The Singapore Navy's Next Wave


http://www.mindef.gov.sg/imindef/resourcelibrary/cyberpioneer/topics/articles/features/2014/may14_cs.html#.U2cpUPmSy0I

Naval engineer ME3-1 Rajendran s/o Ramachandran won several academic awards last year after going back to school after 16 years to earn a Diploma in Marine Engineering as part of the Continuous Learning Academic Study Scheme.

Corporal First Class Nathaniel Loy on the lookout at the Bridge during RSS Tenacious's final sea sortie before it headed to GoA.

ME3 Ramesh giving a command from the Machinery Control Room. He was part of the pioneer crew of RSS Intrepid who were trained overseas. Today, he has returned to the ship as a Naval Engineer.

Acquiring advanced technology and cutting-edge hardware aside, grooming well-trained and committed personnel is the Navy's top priority as it progresses in its 3rd Generation transformation.

As the Republic of Singapore Navy (RSN) prepares itself for future challenges and capabilities, it has not forgotten its roots.
There is an old Chinese saying "才äșș种树,搎äșșäč˜ć‡‰", which translates to "forefathers plant trees so their descendants can enjoy the shade". And following the good example of its forefathers, the RSN has not been content with resting in the shade, but is making sure that generations to come will continue to be protected from the sun.

As Chief of Navy Rear-Admiral (RADM) Ng Chee Peng said at the RSN Workplan Seminar on 25 Mar: "As we continue apace in the new work year, we must cast our minds forward and start seeding developments beyond the 3rd Generation RSN, towards RSN 2030."
Looking a decade-and-a-half into the future shows foresight, and indeed, with the ever-evolving threats to maritime security (MARSEC), machines and systems must be constantly renewed and people continuously trained. However, preparing for the new does not mean discarding the old; sitting under the trees of our forefathers that are still standing tall today, there is still much value in their knowledge. And this is the RSN's plan to move towards 2030: to take care of the planters, to nurture the trees, and to keep planting.

Care for the care-givers

A forest is nothing without the planters that care for it. Appreciating this, the RSN places much emphasis on developing its people. And with about 70 percent of all uniformed naval personnel moving over to the Military Domain Experts Scheme (MDES) in 2010, the Navy has taken steps to strengthen the MDES identity and enhance the knowledge of its Military Experts (MEs).
RADM Ng emphasised that "in growing our capabilities, the RSN has, over the years, poured more and more of our limited resources into our 'fighting teeth'. Going forward, we must ensure that our organisational 'tail' in areas such as training, logistics and engineering, is able to keep up with our 'teeth' of operations and capability development".Hence, on top of establishing the Naval Military Expert Institute as the spiritual home of the MEs, the RSN is reviewing the curriculum across the ME rank continuum to ensure that their skills and knowledge remain relevant to the present and future needs of the Navy.

Enhancements include a tighter coupling of operations doctrines and training curriculum, the use of more advanced shore simulators, more industrial training opportunities, and a closer partnership with institutes of higher learning.For example, the RSN-IMarEST Streamlined Accreditation Programme was recently introduced, allowing RSN personnel, such as engineers, naval officers and divers, to obtain professional accreditation from the Institute of Marine Engineering, Science and Technology (IMarEST).
On the motivations behind offering this accreditation, ME7 Keith Lim, Head Operations Logistics Group, said, "We believe we can give them (the servicemen and women) a sense of security by having ourselves benchmarked against the industry. It provides assurance that what we do is both relevant and highly regarded, and that the organisation is willing to develop its people." ME7 Lim helped to spearhead the programme in 2010.

Applicants must meet certain criteria, such as having held particular appointments that demonstrate their competencies and experience, as well as submit a portfolio documenting their job exposure in the related fields, and sit for an interview.

For instance, ME5 Jackson Ng, who is in the process of obtaining his accreditation, has spent his 11 years in the Navy building up his experience in the area of engineering. To date, he has taken on roles such as Senior Combat Systems Engineer on board frigate RSS Formidable, as well as Senior Engineer in Sensors Systems Branch, Naval Logistics Department. Currently Commanding Officer, Sensor Systems School, he is in charge of the operations and technical training for three vocation specialisations - Navigation Systems, Communications Systems, and Electronic Warfare Systems.ME5 Ng described his experience: "In drafting my work portfolio, it reinforced my belief that my career with the Navy has provided me with ample opportunities and wide exposure to practise and hone my engineering knowledge, as well as develop my engineering management and leadership skills. "With such accreditation, our MEs will be even more well-regarded by the industry and foreign military professionals, thereby enhancing the branding of our people and our Navy."


http://www.mindef.gov.sg/imindef/resourcelibrary/cyberpioneer/topics/articles/features/2014/may14_cs.html#.U2cpUPmSy0I

Phillipines Department of National Defense (DND) Admits Indian, French Shipbuilders to Frigate Program


Morocco Navy's Mohammed V frigate built by STX France. SeaForces.org


The Department of National Defense (DND) accepted the motions for reconsideration of two foreign shipbuilding firms that seek to join the bidding for Philippine Navy's frigate program, a Navy official said.

India state-owned Garden Reach Shipbuilders and Engineers, Ltd. and STX France, SA from Europe joined the P18-billion project to boost the country's maritime forces with new warships, Navy technical working group head Commodore Roland Mercado said in a state news report on Thursday.

DND earlier excluded the firms from the program due to deficiency in documents, but were recently reconsidered by the agency's Special Bidding Awards Committee after  renewing their application.The firms now join Navantia Sepi (RTR Ventures) of Spain, and South Korean contractors STX Offshore and Shipbuilding, Daewoo Shipbuilding and Marine Engineering Co. Ltd. and Hyundai Heavy Industries, Inc. which have passed the first stage of the bidding process.Mercado said the Defense officials are now conducting technical discussions with Garden Reach and STX France. The discussions will aid DND to draft final technical specifications of the required frigates, Mercado explained.

He added that the committee was also tasked to closely scrutinize the hull, power plant, communications systems and weapons systems in the frigate designs submitted.


http://www.philstar.com/headlines/2014/05/01/1318193/dnd-admits-indian-french-shipbuilders-frigate-program


China steps up as exporter of military aircraft


China has yet to complete tests on its J-31 stealth fighter but already ranks third in the world for export contracts for multi-role fighters for 2010 to 2017, behind the United States and Russia.
This shows the country has become a major exporter of military aircraft without relying on fourth- and fifth-generation aircraft.

China has exported 1,700 aircraft to other countries since it began to do so 35 years ago.According to Huanqiu.com, the website of the nationalistic Global Times newspaper, China ranks third mainly because of the approximately 100 FC-1 Xiaolong (also known as the JF-17 Thunder) fighter aircraft delivered or waiting to be delivered to Pakistan or that have been authorized for production, at a total value of US$2.52 billion.

China has so far delivered 45 of the fighters fighters worth US$870 million and will deliver at least 55 more, valued at US$1.65 billion, over the next four years.The lightweight, single engine multi-role combat aircraft, developed by Chengdu Aircraft Corp of China and the Pakistan Aeronautical Complex, has been the leading fighter export since the phasing out of the J-7. More than 10 developing nations have shown interest in this cheap and functional third-generation fighter aircraft.

In addition, K-8 trainer aircraft have also brought in significant revenue for China, and it is one of only a few export aircraft that earn money. Egypt has been the largest overseas customer, buying and producing 120 K-8 trainer aircraft.China has also exported 25 Yu-8 transport aircraft.

Will the Anthropocene last for only 100 years?

On November 9, 2013, methane levels as high as 2662 ppb (parts per billion) were recorded, as indicated by the red dot on the image below.

This image, from an earlier post, gives an idea of the height of this level compared to historic methane levels, and how fast levels of methane (CH4) have been rising compared to levels of two other greenhouse gases, i.e. carbon dioxide (CO2) and nitrous oxide (N2O).

CO2 concentrations in the atmosphere have now risen to levels well above the 400 parts per million (ppm), as illustrated by the graph below, from keelingcurve.ucsd.edu. This 400 ppm is 143% the pre-industrial peak level of 280 ppm.

Paleorecords show that greenhouse gases levels go up and down in lockstep with temperatures in history. The image below shows that carbon dioxide levels back in history typically moved between approximately 180 ppm and 280 ppm, a difference of 100 ppm. Since 1950, CO2 levels have risen by roughly the same difference.


In a fascinating lecture, Dr Jan Zalasiewicz suggests that the Anthropocene started around 1950, when levels of greenhouse gases started to rise exponentially, in line with the rise of fossil fuel use, as also illustrated by the image below.


The image below, from an 
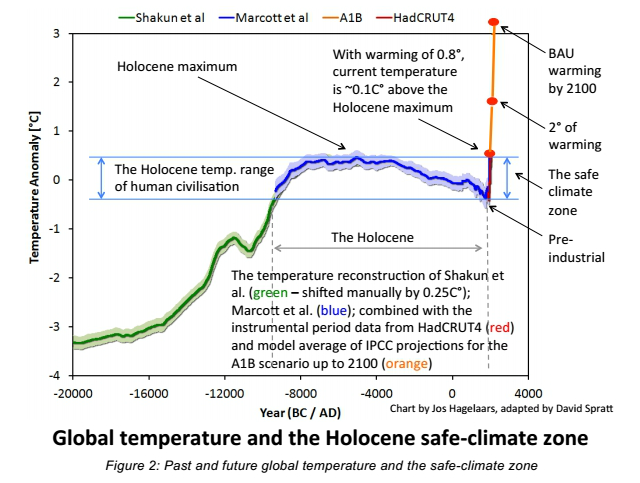
earlier post, shows that temperatures typically moved up and down by roughly 10 degrees Celsius between a glacial and interglacial phase of the ice ages, suggesting that a 100 ppm rise of carbon dioxide and 300 ppb rise of methane go hand in hand with a 10°C temperature rise.

Many eminent scientists have warned that the high current carbon dioxide levels have already locked us in for a future temperature rise of several degrees Celsius, a rise that is yet to fully manifest itself and that is only held off by the temporary masking effect of sulfur dioxide that is emitted when burning fuel (especially coal) and by the (decreasing) capacity of oceans, ice sheets and glaciers to act as a buffer for heat. Once the masking effect of sulfur dioxide ends and the Arctic sea ice collapses, a huge sudden rise in temperature can be expected, hitting vulnerable pools (see image below) which would accelerate the temperature rise even more and could cause temperatures to rise by another 10°C within decades.


The scenario of such a huge rise in temperature becomes a distinct possibility when considering the combined warming impact of carbon dioxide, methane, nitrous oxide, water vapor and albedo changes, and the vulnerability of some of the terrestrial and marine carbon pools. Also note that, while the above Unesco image gives an estimate of 104 or 10,000 Gt C for ocean methane hydrates, several studies give even higher estimates, as illustrated by the image below, from Pinero et al.


The amount of carbon stored in hydrates globally was in 1992 estimated to be 10,000 Gt (USGS), while a later source gives a figure of 63,400 Gt C for the Klauda & Sandler (2005) estimate of marine hydrates. A warming Gulf Stream is causing methane eruptions off the North American coast. Furthermore, methane appears to be erupting from hydrates on Antarctica, on the Qinghai-Tibetan Plateau and on Greenland. In just one part of the Arctic Ocean alone, the East Siberian Arctic Shelf (ESAS), up to 1700 Gt of methane is contained in sediments in the form of methane hydrates and free gas. A sudden release of just 3% of this amount could add over 50 Gt of methane to the atmosphere, i.e. some seven times what is in the atmosphere now, and experts consider such an amount to be ready for release at any time.

Importantly, methane levels have risen even more strongly than carbon dioxide levels. As the image at the top of this post shows, the current methane level is 250% its pre-industrial peak level, i.e. 1100 ppb above the pre-industrial peak level of 700 ppb. Historically, methane has only moved by some 300 ppb between a glacial and interglacial phase of the ice ages. IPCC/NOAA figures suggest that global mean methane levels have been rising by 5 or 6 ppb annually over recent years and there are some worrying indications that the rise of methane levels might accelerate even further.

To obtain mean methane abundance, measurements are typically taken at an altitude of 586 mb, as methane typically shows up most prominently at this altitude. Indeed, mean methane levels were highest at this altitude in April 2013, at just under 1800 ppb. Looking at mean global methane levels in April 2014 at this altitude, one could at first glance conclude that the situation had not changed much, and that 2014 methane levels had merely risen by a few ppb, in line with IPCC data. So, at first glance one might conclude that there may appear to be only a minimal rise (if any at all) in global mean methane levels when taking measurements at lower altitudes.

The image below illustrates this. What should be added is that the analysis used only selected altitudes and only used part of all data. So, further analysis may be necessary to verify these findings.


Importantly, closer examination of above graph shows that the situation is dramatically different when looking at the rise in methane levels at higher altitudes. A huge rise in mean methane levels appears to have taken place, to the extent that the highest mean level is now reached at 469 mb. Overall, the average rise in methane across the altitudes that are highlighted in the image is no less than 16 ppb.

The table below shows the altitude equivalents in mb (millibar) and feet.
56925 feet44689 feet36850 feet30569 feet25543 feet19819 feet14383 feet8367 feet1916 feet
74 mb147 mb218 mb293 mb367 mb469 mb586 mb742 mb945 mb

As the image below illustrates, this rise appears to go hand in hand with much higher peak readings, especially at higher altitudes. It appears that the additional methane originates from the higher latitudes of the Northern Hemisphere and has over the past few months moved closer to the equator, which is what typically occurs as methane rises in altitude.


Peak readings in above image are averages over April. On specific days, peak readings could be much higher, e.g. on April 28, 2014, methane levels were recorded as high as 2551 ppb at 469 mb.

As said, there appears to be a 16 ppb rise when comparing global mean methane levels between April 2013 and April 2014. Indeed, the culprit appears to be the rapid rise of methane emissions from hydrates that has been documented by this blog and that I estimated to amount to 99 Tg annually, as illustrated by the image below, from an earlier post.


So, it appears that the rise of methane in the atmosphere is accelerating. What can we expect? As temperatures can be expected to continue to rise and as feedbacks start to kick in, this may well constitute a non-linear trend. The image below shows a polynomial trend that is contained in IPCC AR5 data from 1955 to 2011, so they didn't include this recent steep rise. Nonetheless, the polynomial trendline points at methane reaching mean global levels higher than 3000 ppb by the year 2030. If methane starts to erupt in large quantities from clathrates underneath the seafloor of the Arctic Ocean, this may well be where we are heading.
So, how high could temperatures rise? Worryingly, a non-linear trend is also contained in the temperature data that NASA has gathered over the years, as described in an earlier post. A polynomial trendline points at global temperature anomalies of 5°C by 2060. Even worse, a polynomial trend for the Arctic shows temperature anomalies of 4°C by 2020, 7°C by 2030 and 11°C by 2040, threatening to cause major feedbacks to kick in, including albedo changes and methane releases that will trigger runaway global warming that looks set to eventually catch up with accelerated warming in the Arctic and result in global temperature anomalies of 20°C+ by 2050.


Without action, it appears that the Antropocene will lead to extinction of the very human beings after which the era is named, with the Anthropocene only running from 1950 to 2050, a mere 100 years and much too short to constitute an era. In that case a better name would be the Sixth Extiction Event, as also illustrated by the image below, from an earlier post.


In conclusion, it's high time that we start acting as genuinely wise modern human beings and commit to comprehensive and effective action as discussed at the Climate Plan blog.